Phoenix hot–dry severity
This case estimates severity and clustering in a derived, EWMA-normalized hot–dry index. It is a statistical illustration, not a calibrated drought or health-risk index.
Construct the daily severity index
The source is NOAA GHCN-Daily station USW00023183, Phoenix Airport. Quality-screened
TMAX and PRCP are converted to degrees Celsius and millimetres. P30_t is the
sum of the preceding 30 days including the current day; all 30 observations
must be available. Input completeness determines the longest continuous run
before the severity index is computed.
For each numerical day-of-year group in that retained run, compute the sample mean and standard deviation of TMAX and P30, then define:
H_t = max((TMAX_t − mean_doy(TMAX)) / sd_doy(TMAX), 0)
D_t = max((mean_doy(P30) − P30_t) / sd_doy(P30), 0)
X_t = H_t + D_t
The climatology uses the full retained period, including later observations
relative to earlier dates. This is retrospective standardization. The implemented
dayofyear grouping is not a leap-adjusted month/day climatology. Overlapping
30-day precipitation sums also introduce dependence into the derived index.
EWMA normalization
The second step divides the nonnegative index by its past EWMA level:
Y_t = X_t / m_t
m_t = ρ m_(t−1) + (1−ρ) X_(t−1),  ρ = 2^(−1/180)
Initialize m with the first 30 index values, then fit from the next day.
The fitted sample is 1948-01-29–2025-12-31, with 28,462 consecutive days.
True zero-severity days remain. Y_t is a dimensionless ratio to recent severity;
only this EWMA step is past-only. It does not make the preceding climatology
point-in-time, and does not establish removal of seasonality.
EVI, EI, and design-life levels
| Quantity | Estimate | Conditional 95% CI |
|---|---|---|
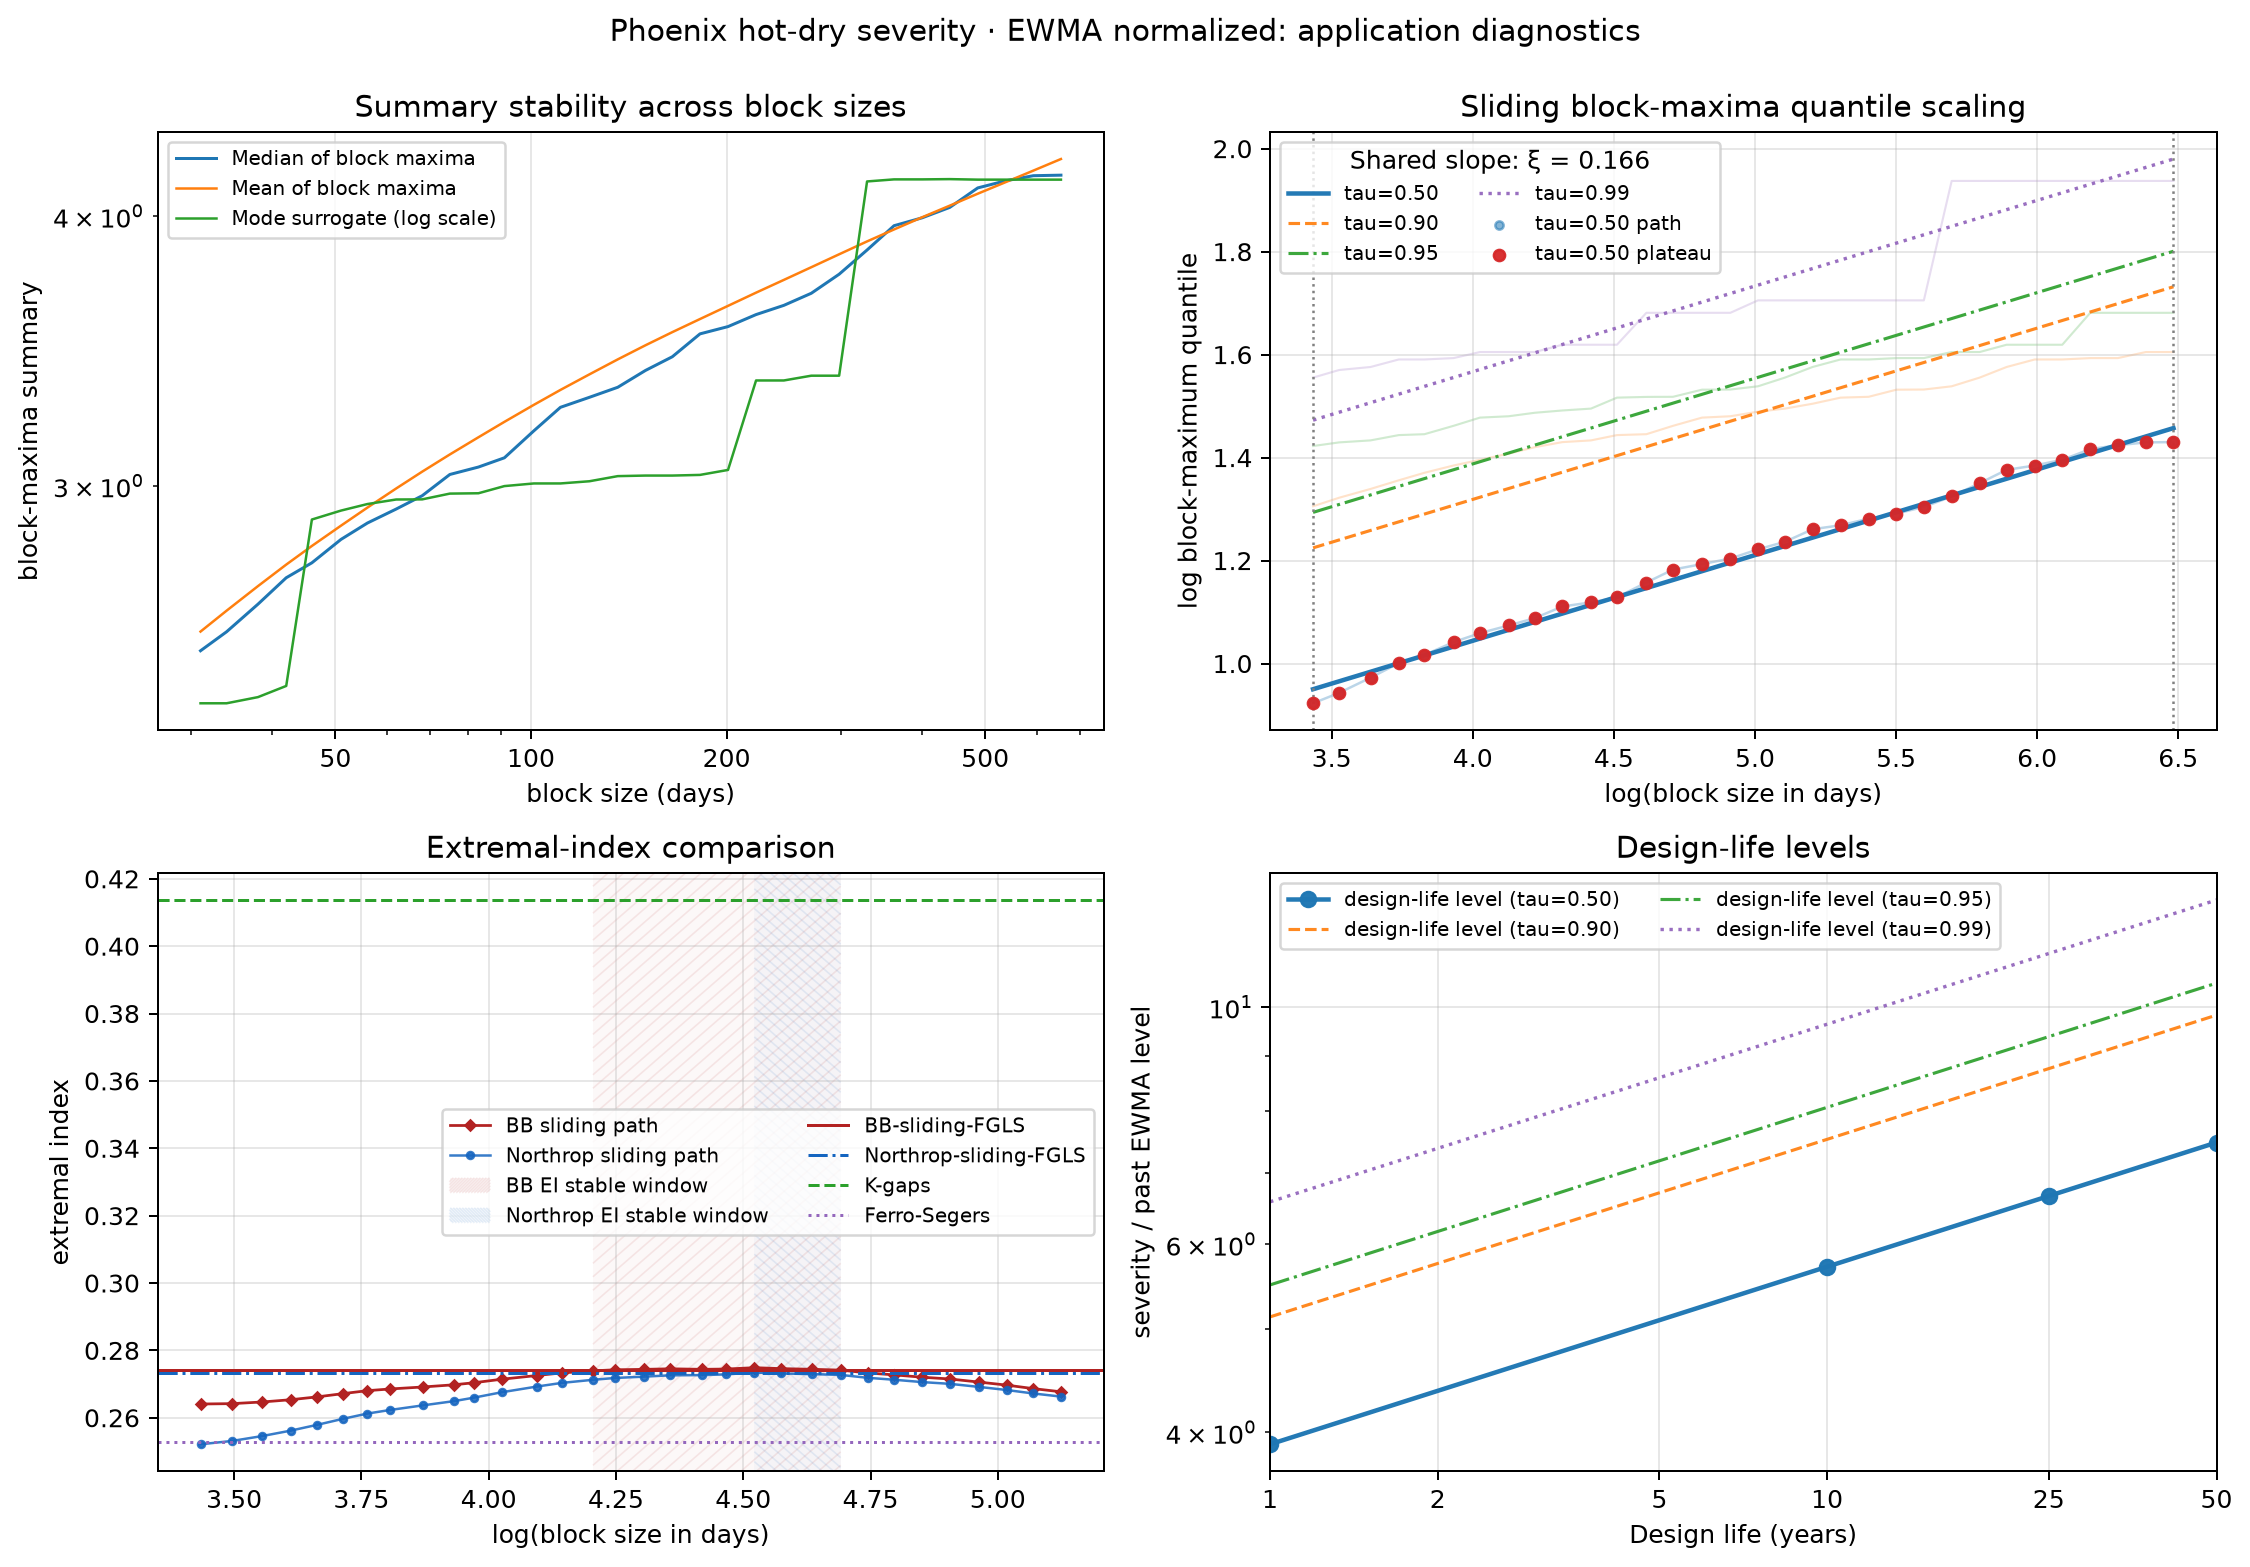
| EVI ξ | 0.166 | [0.156, 0.176] |
| BB-sliding-FGLS EI θ | 0.274 | [0.256, 0.294] |
| Northrop-sliding-FGLS EI θ | 0.273 | [0.250, 0.298] |
Download numerical results and preparation settings (JSON).
The selected EVI window is 31–654 days. Design-life curves use 365.25 daily observations per year. They refer to a maximum relative index value, not a temperature, precipitation deficit, or direct hazard threshold. EI cannot be interpreted as the duration of a heatwave or drought episode.
The nominal CIs use the common FGLS/Wald settings. They omit uncertainty in the full-period climatology, EWMA scale, selected record, and fit window. A narrow conditional CI does not resolve those sources of uncertainty.
Reproduce
PYTHONPATH=scripts uv run python -m application.docs_cases --keys phoenix_hot_dry_severity
Preparation uses the tracked normalization code and the archived GHCN station input.