Streamflow
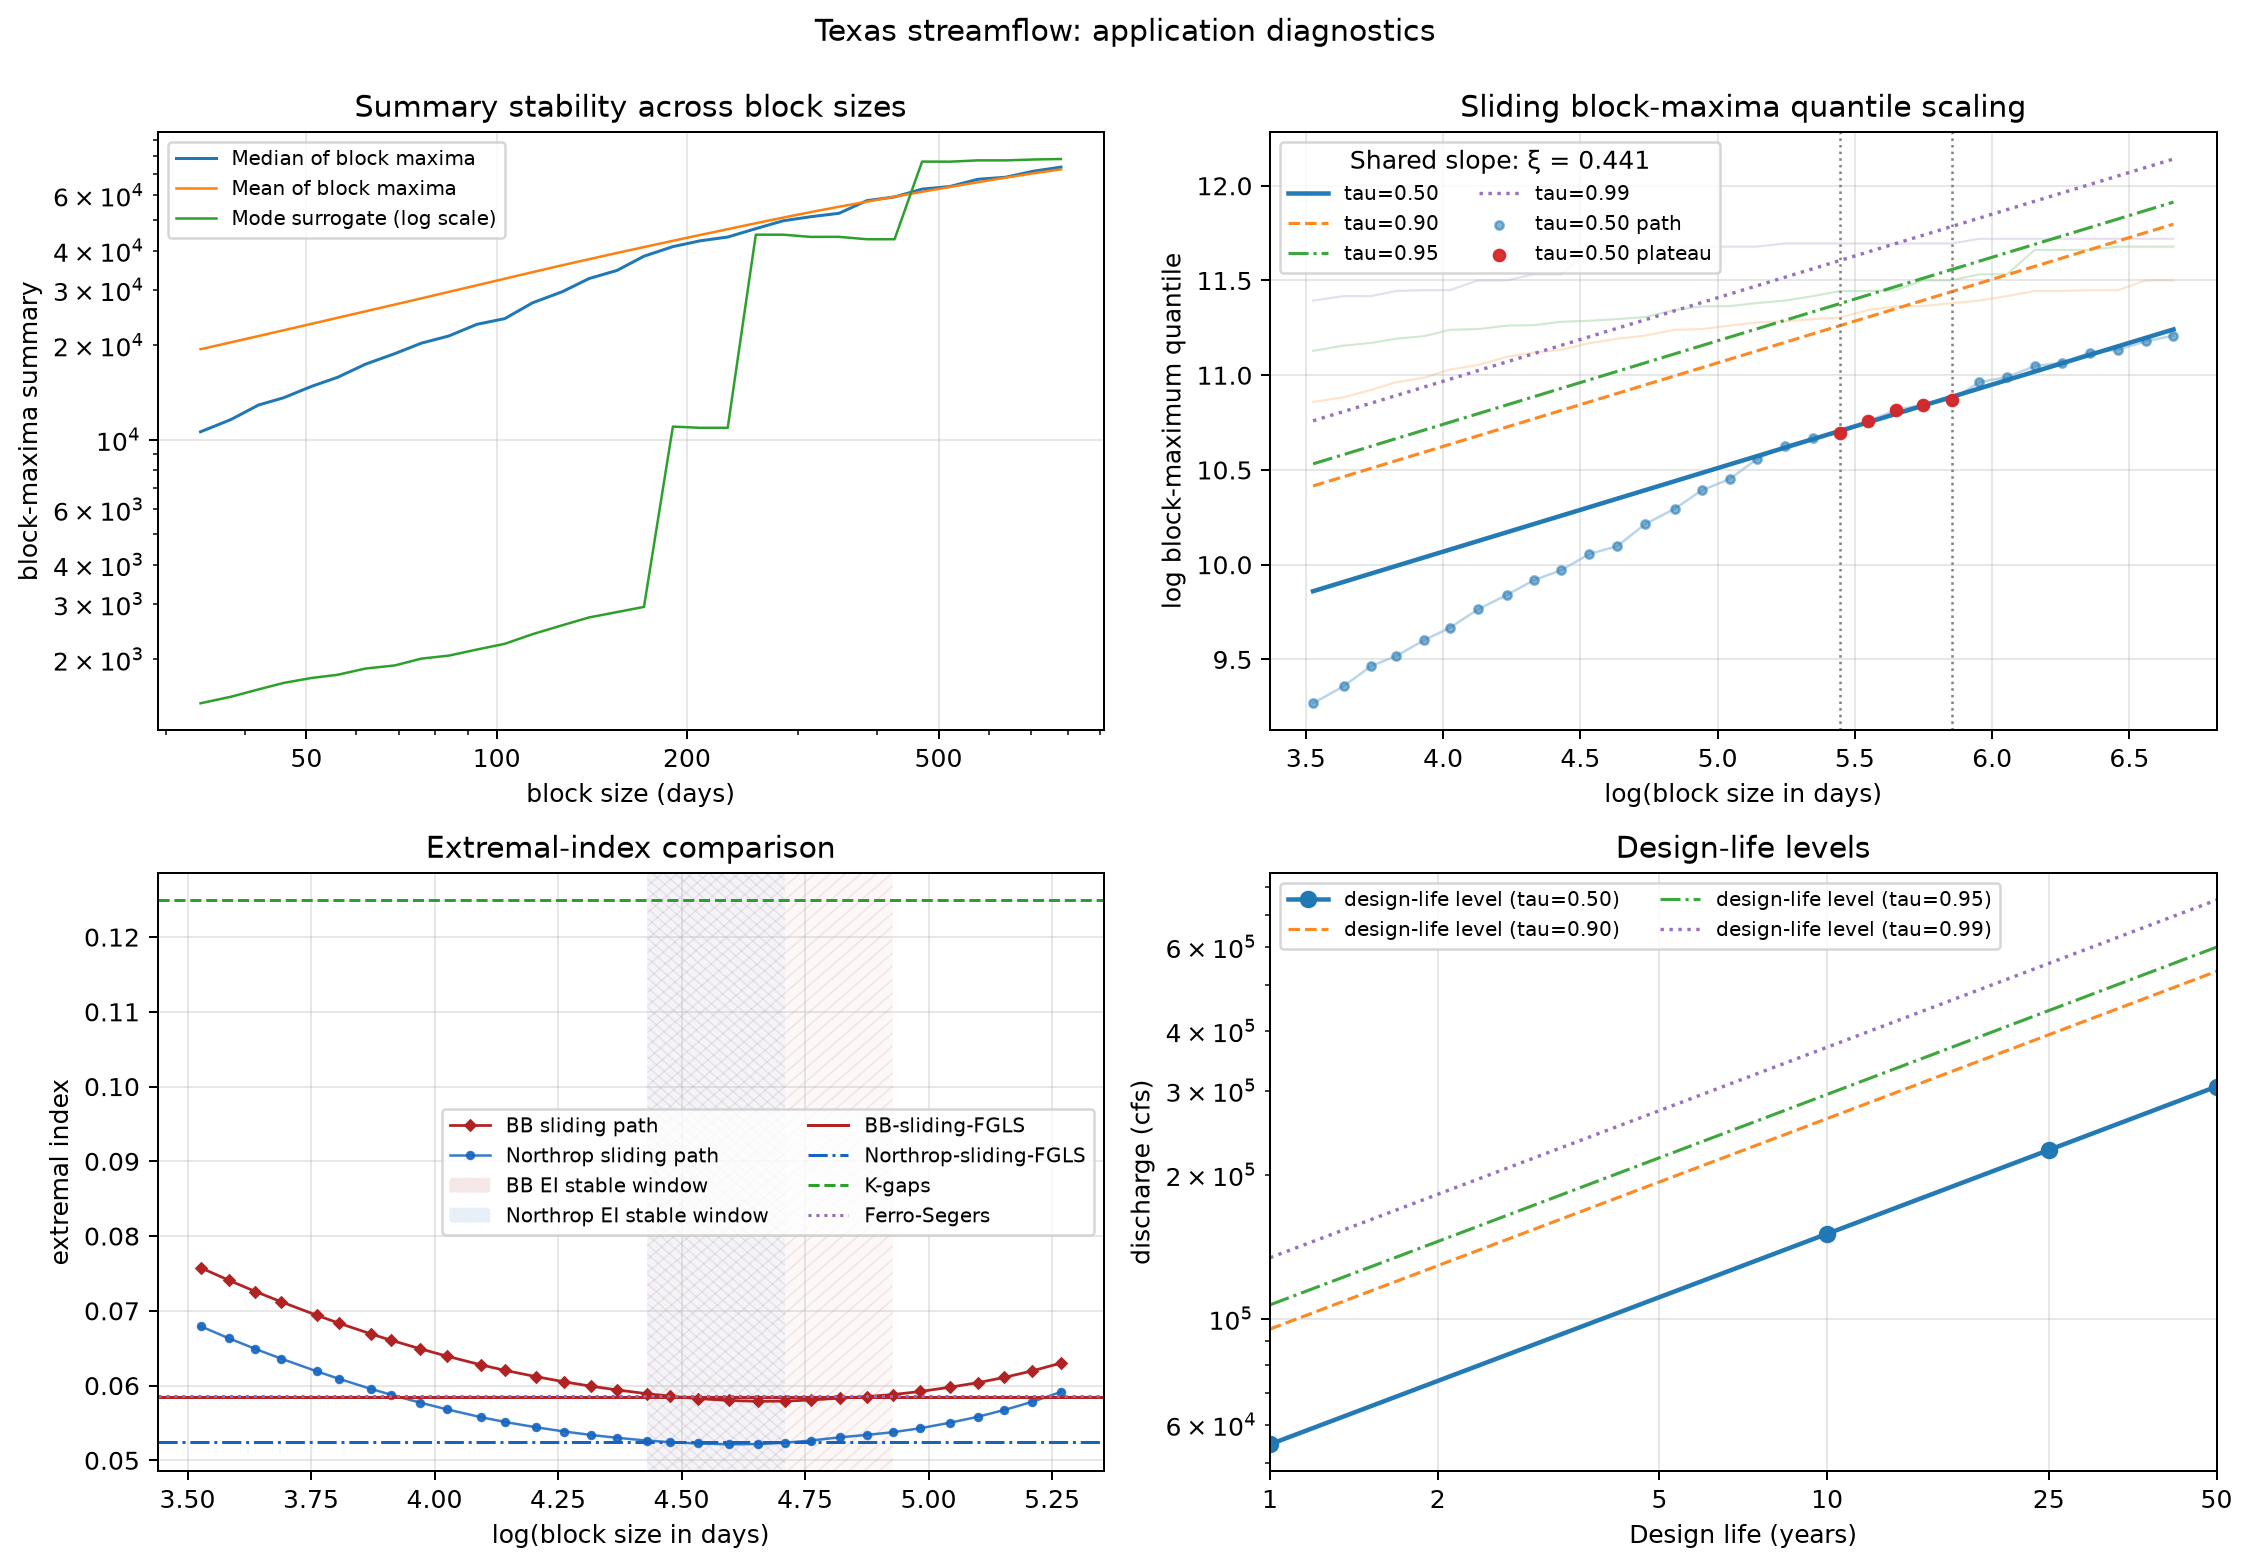
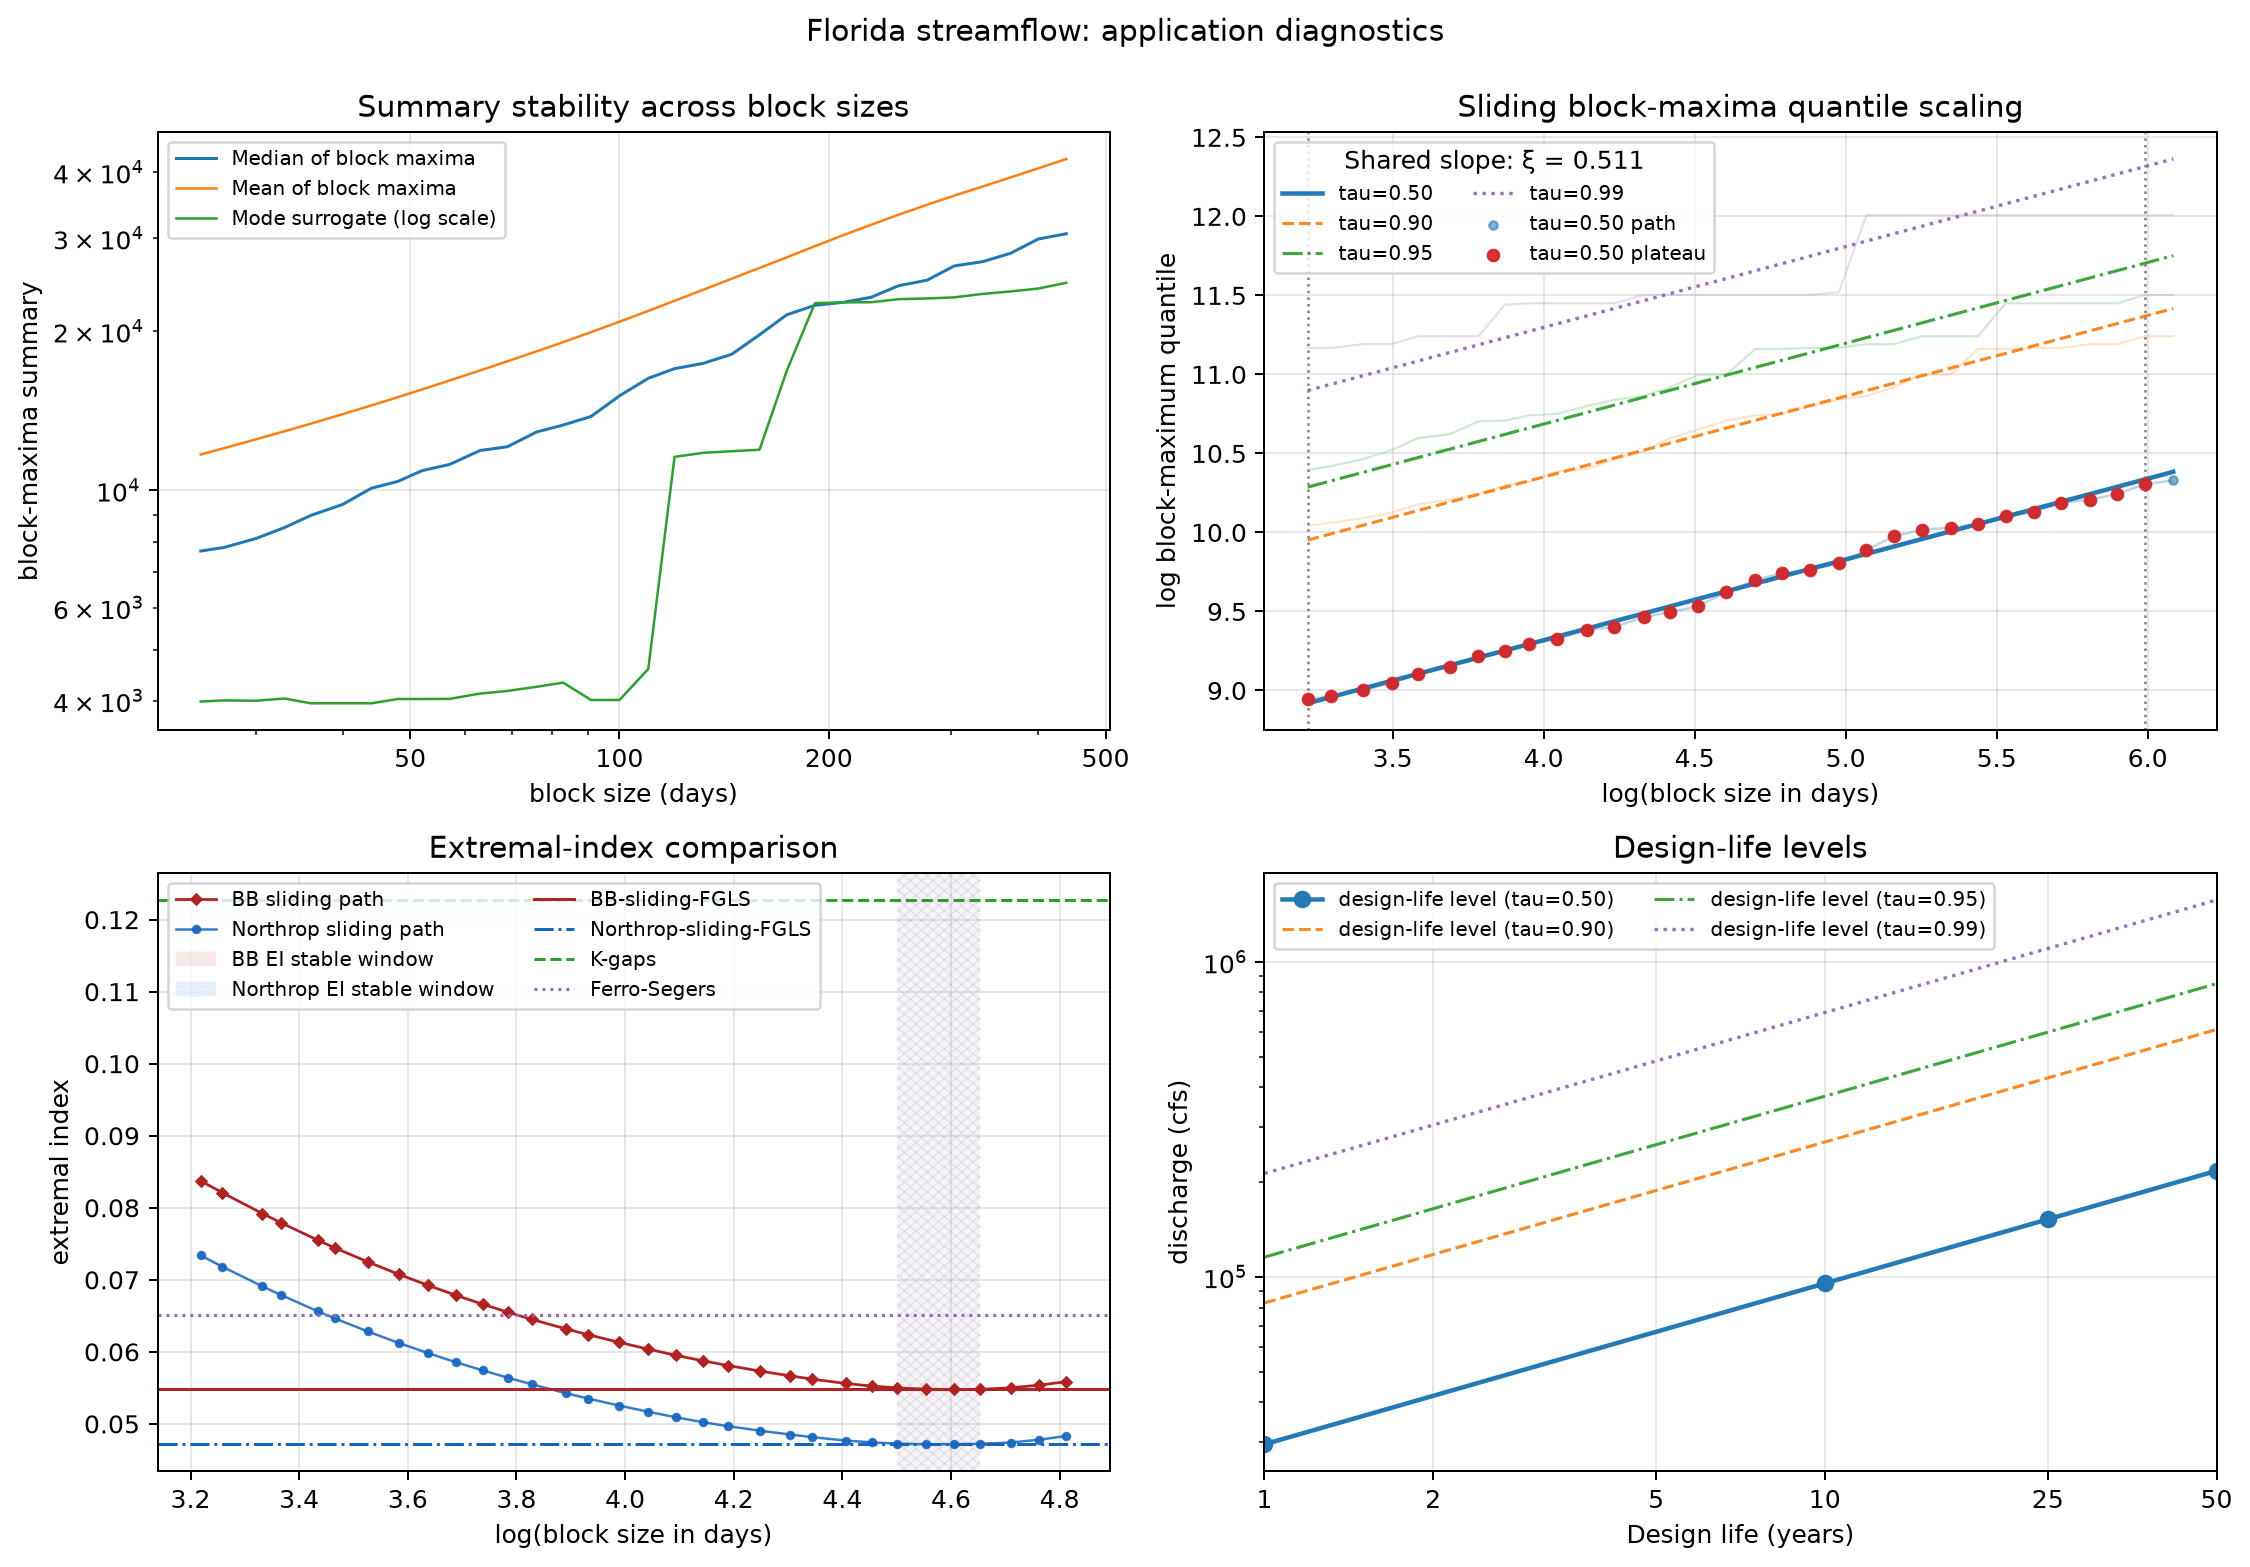
The paired streamflow cases describe how the maximum daily mean discharge scales with the design life and how strongly extreme daily flows cluster in time.
Scale. These are raw daily mean discharge series, with no EWMA normalization. The complete retained records are used; no 30-day normalization warmup is removed. The target is the maximum daily mean discharge, not the instantaneous flood peak.
These fits use fixed shrinkage 0.73 for EVI, 0.37 for EI, and adaptive R on archived provider inputs. The USGS screening step selects the top-ranked site in each state under the current analysis settings; Texas now uses Brazos River at Richmond rather than the earlier Trinity River at Romayor example.
Texas — Brazos River at Richmond
Data. USGS site 08114000: 37,713 daily mean discharge observations from
1922-10-01 to 2025-12-31, spanning 103.3 years. After removing repeated dates
and invalid discharge values, the analysis retains the longest gap-free daily
suffix ending at the fixed cutoff. Missing days are not imputed or compressed.
Both branches use this continuous calendar-day record.
The separate GEV scale check groups observations by January–December calendar year and retains only years meeting the predeclared 97% finite-daily-coverage gate. The selected Texas and Florida windows contribute 103 maxima from 1923–2025 and 41 from 1985–2025, respectively. All retained years have complete daily coverage; the incomplete initial years, 1922 and 1984, are excluded.
Estimands. EVI ξ describes the fitted severity-scaling slope. EI θ is
dimensionless and describes extremal clustering. It is reported separately and
is not inserted into the design-life formula. Discharge levels are in cubic
feet per second (cfs).
Download numerical results and preparation settings (JSON).
Florida — Choctawhatchee River near Bruce
Data. USGS site 02366500: 15,189 daily mean discharge observations from
1984-06-01 to 2025-12-31, spanning 41.6 years. Although the archive begins on
1930-10-01, this is the longest gap-free suffix ending at the cutoff. Both
branches use the retained continuous calendar-day record.
Download numerical results and preparation settings (JSON).
Severity scaling and the GEV comparison
The selected EVI windows span 232–348 calendar days in Texas and 25–400 in
Florida. Their fitted slopes are 0.441 and 0.511; the conditional intervals
overlap, so these fits do not establish a difference in tail severity.
Both 50-year targets use b_50=18,263 calendar days, about 52.5 and 45.7 times
the respective largest fitted block size. These ratios compare block sizes,
not historical record lengths.
L-moment GEV fits to calendar-year maxima provide a separate hydrologic scale check. Discharge levels below are in thousands of cfs:
| Site | GEV 50-year return level | UniBM median 50-year design-life level [95% CI] |
|---|---|---|
| Texas | 116 | 306 [73.5, 1,274] |
| Florida | 133 | 217 [171, 276] |
The GEV return level is an upper quantile of annual maxima; the UniBM level is the median maximum over 50 years. These are different probability targets, so the table is not a comparison of predictive accuracy. The difference in probability targets and the wide Texas interval require caution when comparing magnitudes. These extrapolations are illustrations of the selected finite-block scaling relation, not validated design values.
Interpretation and use
The two sites have similar EI point estimates; their EVI intervals overlap. Clustering of upper-tail exceedances and growth of maximum discharge are complementary features; EI does not measure elapsed or consecutive-day flood duration.
The confidence intervals quantify estimation uncertainty in the median design-life levels under the stationary working model. The fits do not explicitly model seasonal or long-term changes, regulation, or land-use effects. Standard flood-frequency estimates can be supplemented by these severity and clustering summaries when periods, discharge definitions, and probability targets are aligned.
- Preparation:
scripts/data_prep/usgs.py - Selection disclosure:
data/metadata/application/usgs_frozen_sites.json - Provider: USGS Water Services