Results and Discussion
Generated by just snapshot from artifacts/full_with_peer at 2026-07-20T16:33:45+00:00.
Connection to Paper Plan
This page is the artifact-backed Results and Discussion companion to docs/paper_plan.md. The paper plan defines the research question, Materials and Methods, metric choices, and expected experiments; this snapshot reports the realized outcomes from those experiments using the current study artifacts.
The structure below follows the planned experiment sequence: benchmark timing, concept drift, opacity, public-cascade construction, public-cascade prediction, and benchmark-public construct overlap. Each package table and figure is rendered once in the experiment that owns it.
When using this page for manuscript prose, read it as an interpretation guide rather than a model leaderboard.
Headline claims should describe filing-origin measurement, prevalence-aware ranking, and construct overlap within the stated bridge tier.
Alternative windows and exploratory maxima remain diagnostics; the sole headline public specification is all + expanding.
Results Overview
-
Research question. Can filing-origin SEC/PCAOB information predict whether an issuer later records submission-dated correspondence or public correction outcomes, and how does this review-and-correction construct relate to, but differ from, the detected-misstatement benchmark?
-
Data. The workflow combines the
gvkey x data_yeardetected-misstatement benchmark, the public SEC/PCAOB lake, the goldissuer_origin_panelandfiling_origin_panel, and a raw-onlygvkey-CIK-yearbridge for overlap validation. -
Models. The core public cascade uses XGBoost over metadata, XBRL, auditor, Prior-filing history (legacy artifact key: oversight), visibility/history, and all-feature sets. Note/disclosure-breadth variables enter
allwithout a standalone ablation. Peer-compatible Dechow, Perols, Bao, and Bertomeu-style suites are included when the peer-enabled study directory is present. -
Metrics. The common metric vocabulary is PR-AUC relative to prevalence, ROC-AUC, Brier, Brier Skill Score, ECE, top-k precision, top-decile lift, and Bao-style top-fraction precision, sensitivity, specificity, BAC, and NDCG.
-
Bridge boundary. Construct overlap is
wrds_validatedusing the confirmed WRDS SEC Analytics Suite CIK-GVKEY bridge. -
Bounded contribution. The study develops a filing-origin, submission-dated measure of review-and-correction outcomes and evaluates prevalence-aware ranking. It does not identify hidden misconduct, causal regulatory effects, or same-estimand superiority over detected-misstatement studies.
Results for Experiment 1: Label Observability and Detection Timing
This experiment reads detected-misstatement benchmark performance as an observability diagnostic rather than a hidden-misconduct detection result.
table_05_benchmark_timing_metrics
- Claim. Detected-misstatement benchmark performance is sensitive to label observability and timing assumptions.
- Evidence. Naive, proxy-imputed, and proxy-drop timing modes are compared under annual out-of-time folds.
- Boundary. This is benchmark-validity evidence, not a hidden-misconduct detector result.
Table: Detected-misstatement benchmark timing diagnostics
| Label_Mode | Best_Window | n_folds | valid_folds | Mean_PR_AUC | PR_AUC_Dispersion | Mean_ROC_AUC | Top_100_Precision | Retained_Positive_Share |
|---|---|---|---|---|---|---|---|---|
| naive | rolling_5y | 14 | 14 | 0.0702 | [0.0465, 0.0939] | 0.7261 | 0.0829 | 1.0000 |
| proxy_imputed_lag_1y | rolling_7y | 14 | 14 | 0.0432 | [0.0349, 0.0514] | 0.6699 | 0.0636 | 0.8855 |
| proxy_imputed_lag_2y | expanding | 14 | 14 | 0.0405 | [0.0327, 0.0482] | 0.6684 | 0.0557 | 0.9037 |
| proxy_imputed_lag_3y | expanding | 14 | 14 | 0.0339 | [0.0290, 0.0389] | 0.6509 | 0.0450 | 0.8423 |
| proxy_imputed_lag_5y | expanding | 14 | 14 | 0.0303 | [0.0264, 0.0343] | 0.6274 | 0.0429 | 0.6874 |
| proxy_drop_observed | rolling_5y | 14 | 14 | 0.0239 | [0.0199, 0.0279] | 0.5404 | 0.0314 | 0.0549 |
Note: PR-AUC dispersion entries are descriptive fold-dispersion intervals over annual out-of-time test folds after excluding sparse folds with fewer than 10 positives. Rolling and expanding training windows overlap, so the intervals describe evaluation-period dispersion rather than independent sampling uncertainty, superpopulation confidence intervals, or causal inference uncertainty. Entries are detected-misstatement label-mode timing diagnostics. Best-window entries are descriptive label-observability sensitivity checks, not headline model-selection claims.
table_06_detected_misstatement_peer_metrics
- Claim. Peer-compatible model families provide benchmark-side metric-language alignment.
- Evidence. Detected-misstatement peer-family PR-AUC and ROC-AUC are reported across valid folds.
- Boundary. These are model-family transfer checks, not exact replications of prior samples or private data settings.
Table: Detected-misstatement peer-compatible model-family metrics
| Model | n_folds | valid_folds | Mean_PR_AUC | PR_AUC_Dispersion | Mean_ROC_AUC |
|---|---|---|---|---|---|
| bertomeu_style_xgb | 14 | 14 | 0.0424 | [0.0361, 0.0487] | 0.6599 |
| perols_logit | 14 | 14 | 0.0315 | [0.0273, 0.0357] | 0.6156 |
| perols_bagged | 14 | 14 | 0.0311 | [0.0275, 0.0347] | 0.6271 |
| perols_linear_svm | 14 | 14 | 0.0306 | [0.0267, 0.0346] | 0.6131 |
| perols_stacking | 14 | 14 | 0.0302 | [0.0260, 0.0344] | 0.6075 |
| perols_mlp | 14 | 14 | 0.0297 | [0.0253, 0.0341] | 0.5888 |
| bao_inspired_tree_ensemble | 14 | 14 | 0.0280 | [0.0241, 0.0319] | 0.6254 |
| dechow_variable_logit | 14 | 14 | 0.0235 | [0.0170, 0.0300] | 0.5225 |
| perols_entropy_tree | 14 | 14 | 0.0227 | [0.0194, 0.0259] | 0.5810 |
Note: PR-AUC dispersion entries are descriptive fold-dispersion intervals over annual out-of-time test folds after excluding sparse folds with fewer than 10 positives. Rolling and expanding training windows overlap, so the intervals describe evaluation-period dispersion rather than independent sampling uncertainty, superpopulation confidence intervals, or causal inference uncertainty. Peer-compatible families are ranking checks under transferred model vocabularies, not calibrated probability comparisons or original-paper replications. Peer-model folds and public-cascade folds can cover different historical sequences, so dispersion widths should not be compared across evidence layers.
Detected-misstatement peer-family PR-AUC
- Claim. Detected-misstatement peer-compatible model families provide benchmark-side metric-language context.
- Evidence. The figure reports Dechow-, Perols-, Bao-, and Bertomeu-style families on the detected-misstatement benchmark task.
- Boundary. These rows are transferred model-family diagnostics, not original-paper numeric replications.
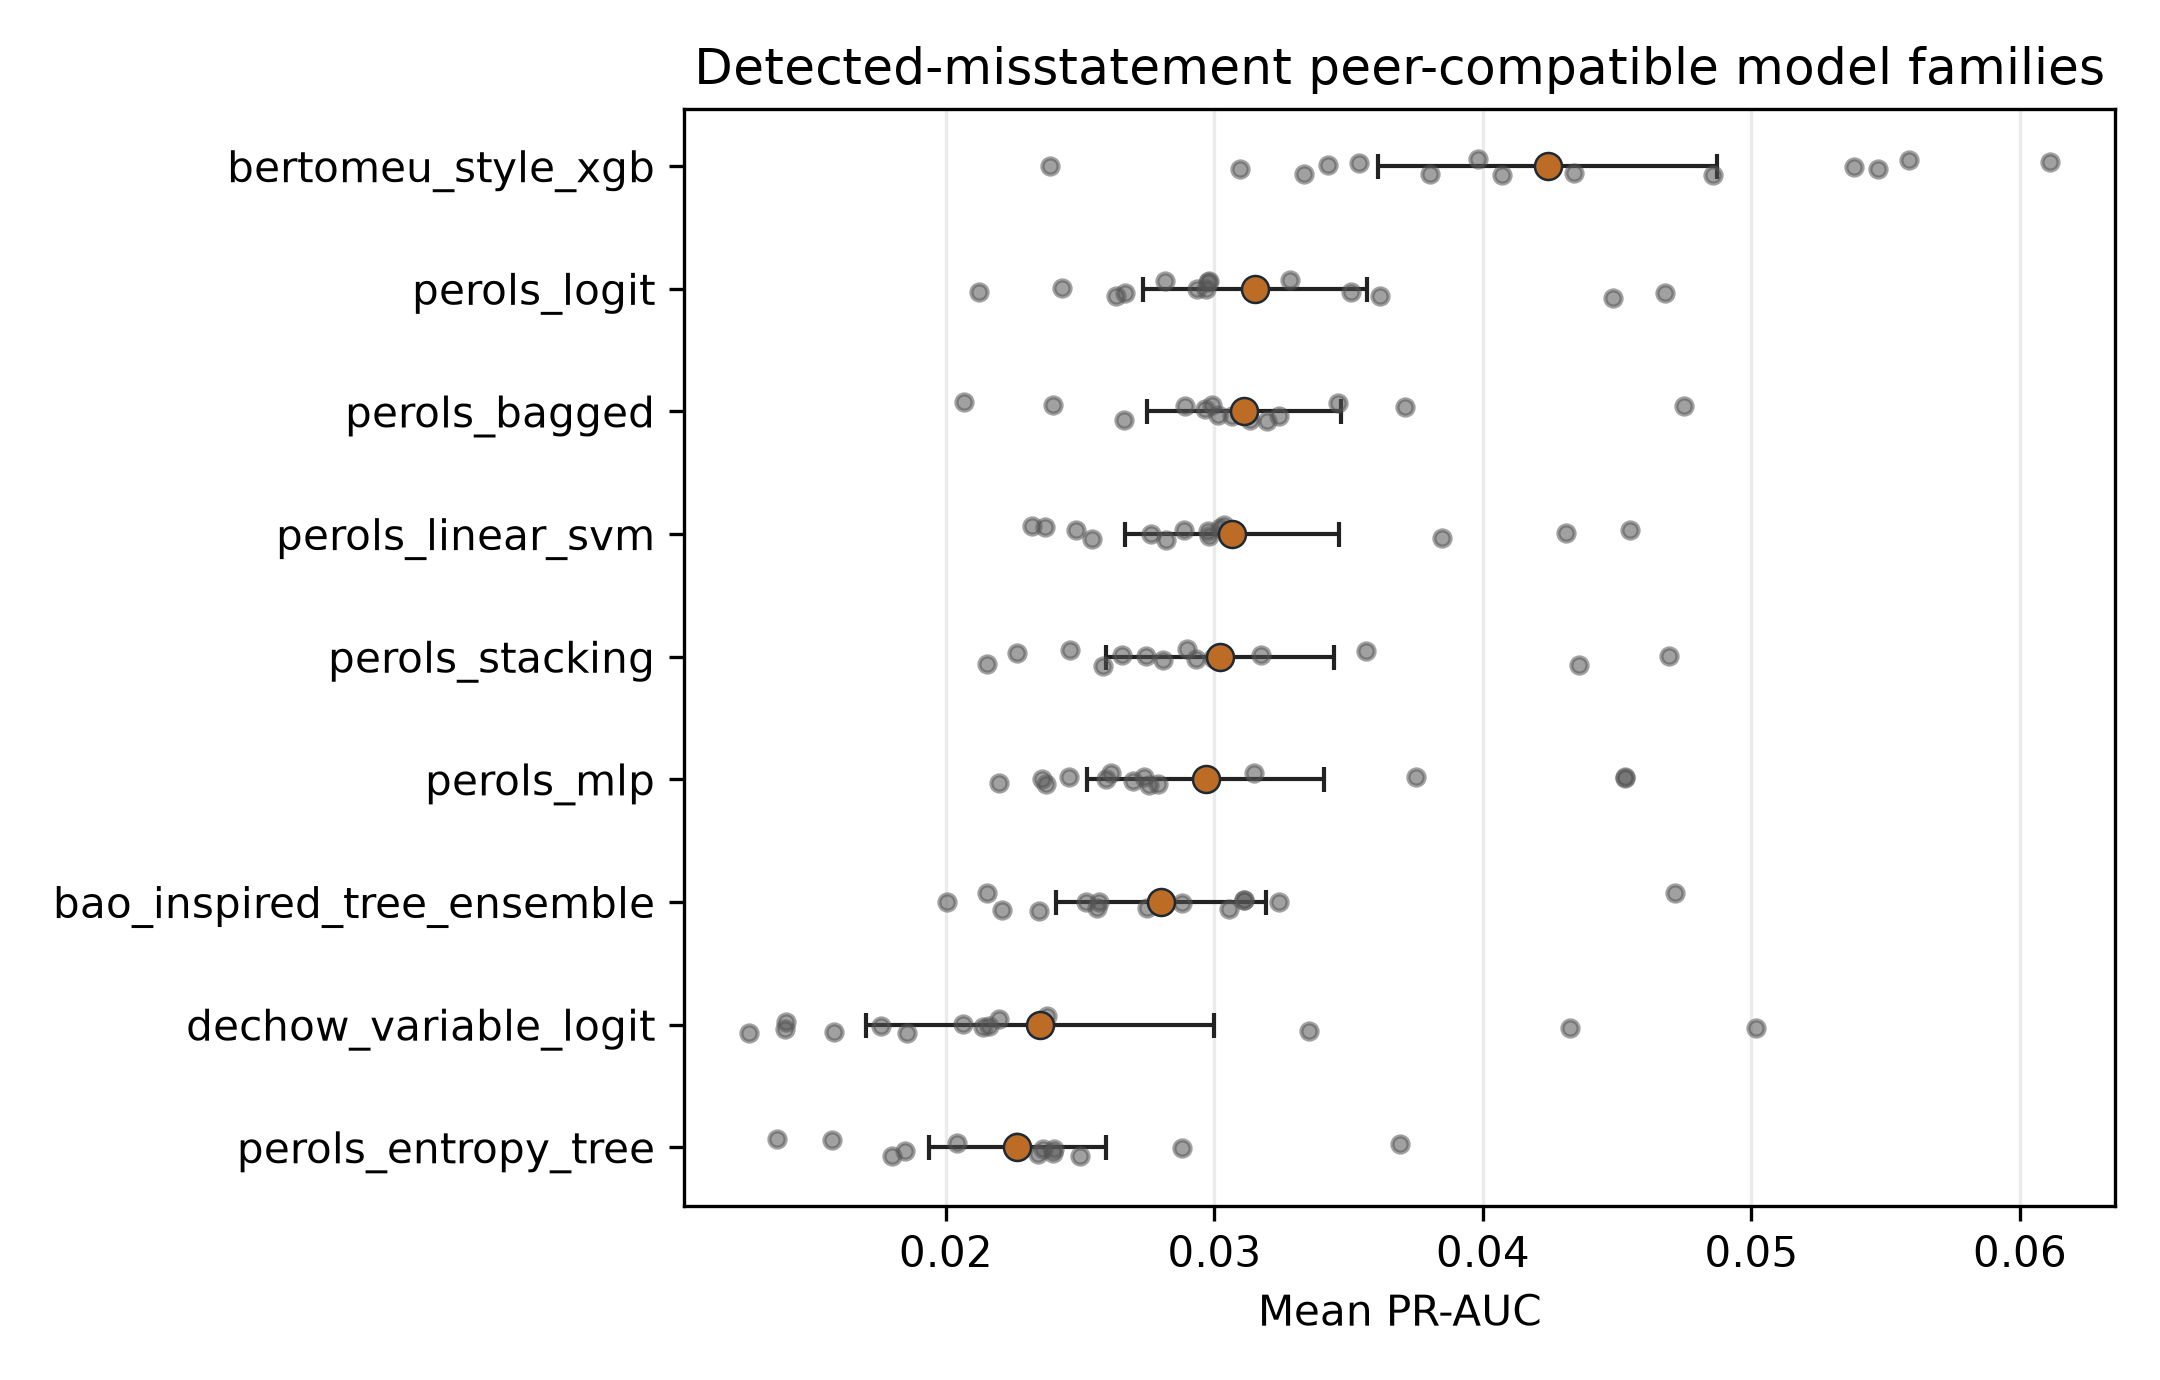
Figure note. Colored bars or dots encode mean PR-AUC; grey points encode valid annual test folds; capped black lines encode descriptive fold-dispersion intervals.
Detected-Misstatement Peer Fit and Skip Status
| Status | Reason | Rows |
|---|---|---|
fit |
fit |
3,024 |
skipped |
missing_required_mapping |
336 |
Detected-Misstatement Benchmark Panel
| Field | Value |
|---|---|
| Rows | 82,908 |
| Firms | 9,156 |
| Years | 2001-2019 |
| Positive rate | 0.0297 |
| Positive rows without timing proxy | 2,309 |
| Timing claim status | proxy_imputed_lag |
Full Window Summary
| Label mode | Window | PR-AUC | ROC-AUC | Brier Skill Score | ECE | Top-100 precision | Top-decile precision |
|---|---|---|---|---|---|---|---|
naive |
rolling_5y |
0.0702 | 0.7261 | -4.1971 | 0.2048 | 0.0829 | 0.0529 |
naive |
rolling_7y |
0.0652 | 0.7322 | -5.1230 | 0.2341 | 0.0779 | 0.0520 |
naive |
rolling_10y |
0.0588 | 0.7348 | -5.9424 | 0.2563 | 0.0771 | 0.0514 |
naive |
expanding |
0.0523 | 0.7357 | -5.4695 | 0.2503 | 0.0686 | 0.0527 |
proxy_drop_observed |
rolling_5y |
0.0239 | 0.5404 | -0.0298 | 0.0146 | 0.0314 | 0.0234 |
proxy_drop_observed |
expanding |
0.0230 | 0.5786 | -0.2866 | 0.0194 | 0.0250 | 0.0254 |
proxy_drop_observed |
rolling_10y |
0.0228 | 0.5588 | -0.1201 | 0.0132 | 0.0250 | 0.0252 |
proxy_drop_observed |
rolling_7y |
0.0218 | 0.5483 | -0.0502 | 0.0133 | 0.0271 | 0.0236 |
proxy_imputed_lag_1y |
rolling_7y |
0.0432 | 0.6699 | -3.3604 | 0.1740 | 0.0636 | 0.0413 |
proxy_imputed_lag_1y |
expanding |
0.0430 | 0.6897 | -3.9825 | 0.1992 | 0.0614 | 0.0410 |
proxy_imputed_lag_1y |
rolling_5y |
0.0423 | 0.6584 | -2.5838 | 0.1418 | 0.0579 | 0.0378 |
proxy_imputed_lag_1y |
rolling_10y |
0.0414 | 0.6836 | -4.1247 | 0.1990 | 0.0600 | 0.0442 |
proxy_imputed_lag_2y |
expanding |
0.0405 | 0.6684 | -3.2242 | 0.1688 | 0.0557 | 0.0397 |
proxy_imputed_lag_2y |
rolling_10y |
0.0374 | 0.6589 | -3.3740 | 0.1677 | 0.0600 | 0.0378 |
proxy_imputed_lag_2y |
rolling_7y |
0.0340 | 0.6398 | -2.7250 | 0.1426 | 0.0479 | 0.0368 |
proxy_imputed_lag_2y |
rolling_5y |
0.0337 | 0.6300 | -1.8475 | 0.1053 | 0.0500 | 0.0329 |
proxy_imputed_lag_3y |
expanding |
0.0339 | 0.6509 | -2.6100 | 0.1385 | 0.0450 | 0.0350 |
proxy_imputed_lag_3y |
rolling_10y |
0.0331 | 0.6372 | -2.7713 | 0.1361 | 0.0464 | 0.0331 |
proxy_imputed_lag_3y |
rolling_7y |
0.0292 | 0.6126 | -1.9625 | 0.1062 | 0.0443 | 0.0291 |
proxy_imputed_lag_3y |
rolling_5y |
0.0275 | 0.5951 | -1.1455 | 0.0658 | 0.0329 | 0.0280 |
proxy_imputed_lag_5y |
expanding |
0.0303 | 0.6274 | -1.7743 | 0.0970 | 0.0429 | 0.0329 |
proxy_imputed_lag_5y |
rolling_10y |
0.0286 | 0.6164 | -1.8568 | 0.0943 | 0.0386 | 0.0302 |
proxy_imputed_lag_5y |
rolling_7y |
0.0273 | 0.5887 | -0.9245 | 0.0543 | 0.0336 | 0.0256 |
proxy_imputed_lag_5y |
rolling_5y |
0.0216 | 0.5422 | -0.0305 | 0.0148 | 0.0300 | 0.0216 |
Interpretation
These outcomes show how much the detected-misstatement benchmark depends on label-timing assumptions and retained-positive coverage. The discussion should treat timing-sensitive performance as evidence about observability, not as a direct estimate of hidden misconduct.
Results for Experiment 2: Concept Drift and Model Shelf-Life
This experiment compares rolling and expanding windows and checks whether feature-family importance shifts around candidate regime breaks.
Strongest Structural-Break Diagnostics
| Window | Label mode | Feature family | Break year | F-stat | p-value |
|---|---|---|---|---|---|
expanding |
proxy_imputed_lag_2y |
accounting |
2005 | 5285.9121 | <0.001 |
expanding |
naive |
accounting |
2005 | 3985.9367 | <0.001 |
expanding |
naive |
market |
2005 | 3810.7723 | <0.001 |
expanding |
proxy_imputed_lag_1y |
accounting |
2005 | 3363.0597 | <0.001 |
expanding |
naive |
audit |
2005 | 3337.9848 | <0.001 |
expanding |
proxy_imputed_lag_2y |
audit |
2005 | 2623.5074 | <0.001 |
rolling_7y |
proxy_imputed_lag_2y |
audit |
2005 | 2592.2930 | <0.001 |
rolling_10y |
naive |
market |
2005 | 2417.0742 | <0.001 |
rolling_7y |
proxy_imputed_lag_1y |
market |
2005 | 2284.4359 | <0.001 |
expanding |
proxy_imputed_lag_1y |
industry |
2005 | 2261.5146 | <0.001 |
expanding |
proxy_drop_observed |
accounting |
2005 | 2108.3941 | <0.001 |
rolling_5y |
naive |
market |
2005 | 1944.2735 | <0.001 |
Mean Feature-Family Importance
| Label mode | Feature family | Mean importance share |
|---|---|---|
proxy_drop_observed |
accounting |
0.3734 |
proxy_imputed_lag_5y |
accounting |
0.3258 |
proxy_imputed_lag_3y |
accounting |
0.3038 |
proxy_imputed_lag_1y |
accounting |
0.3004 |
proxy_imputed_lag_2y |
accounting |
0.2983 |
naive |
accounting |
0.2931 |
naive |
industry |
0.1782 |
proxy_imputed_lag_3y |
audit |
0.1773 |
proxy_imputed_lag_5y |
audit |
0.1771 |
proxy_imputed_lag_2y |
audit |
0.1767 |
proxy_imputed_lag_1y |
audit |
0.1733 |
naive |
missingness |
0.1722 |
Interpretation
These tables translate the paper-plan shelf-life question into realized window-level and feature-family evidence. Large window differences or breakpoint rows should be read as model-maintenance evidence rather than causal regime-shift proof.
Results for Experiment 3: Opacity and Public Review/Correction Risk
The opacity analysis reports adjusted associations from DML partially linear regressions. These estimates are not causal effects.
table_12_public_opacity_dml
- Claim. Opacity/missingness has at most diagnostic adjusted-association evidence for the current outcomes.
- Evidence. DML-style coefficients, issuer-clustered standard errors, intervals, and p-values are reported by outcome.
- Boundary. These are adjusted associations and do not identify causal selection or strategic silence.
Table: Public opacity DML-style adjusted associations
| Outcome | Status | N_Obs | Prevalence | Raw_Controls | Encoded_Controls | Opacity_Components | Issuer_Clusters | Coef | Clustered_SE | Clustered_CI_95 | P_Value |
|---|---|---|---|---|---|---|---|---|---|---|---|
| comment_thread | fit | 96,734 | 0.2689 | 57 | 60 | 17 | 16026 | -0.0328 | 0.1048 | [-0.2382, 0.1725] | 0.7539 |
| amendment | fit | 96,734 | 0.1853 | 57 | 60 | 17 | 16026 | -0.1985 | 0.0933 | [-0.3814, -0.0155] | 0.0335 |
| 8k_402 | fit | 96,734 | 0.0215 | 57 | 60 | 17 | 16026 | -0.0199 | 0.0332 | [-0.0849, 0.0451] | 0.5485 |
Note: Raw controls are source variables before encoding; encoded controls are nuisance-model columns reported at the maximum fold-local width after training-fold categorical expansion and imputation; opacity components form the missingness-density treatment. Cross-fitting keeps all rows for an issuer in the same nuisance fold. Intervals and p-values use issuer-clustered OLS covariance with a finite-cluster correction after residualization. The estimates are adjusted associations, not identified structural effects.
Interpretation
The DML rows report adjusted association between filing-origin opacity and later public review/correction outcomes. They distinguish source-availability and missingness diagnostics from silent-imputation claims. Opacity DML is an adjusted-association diagnostic only when at least one required outcome is fitted. Required-outcome statuses are comment_thread=fit, amendment=fit, 8k_402=fit; fitted outcomes are comment_thread, amendment, 8k_402; aggregate maturity is diagnostic. With at least one fitted required outcome, opacity DML is an adjusted-association diagnostic only.
Results for Experiment 4: Public Cascade Construction
This experiment validates whether public SEC/PCAOB data can support the filing-origin review-and-correction measurement surface.
table_02_public_lake_scale
- Claim. The public SEC/PCAOB lake supports the filing-origin measurement surface at scale.
- Evidence. Silver and gold row counts show filing, issuer, XBRL, notes, comment-thread, correction, and annual origin coverage.
- Boundary. Scale and coverage establish feasibility, not causal interpretation or complete regulatory review coverage.
Table: Public data architecture and analytical panel scale
| Layer | Artifact | Artifact_Rows | Description |
|---|---|---|---|
| Normalized | filing_dim | 21,832,838 | Public filing index |
| Normalized | issuer_dim | 970,155 | Issuer dimension |
| Normalized | xbrl_core_fact | 21,839,851 | Controlled XBRL core facts |
| Normalized | xbrl_fact_summary | 421,160 | Accession-level XBRL coverage |
| Normalized | note_summary | 590,306 | Notes summary mode |
| Normalized | comment_thread | 125,493 | Eventually disclosed SEC correspondence archive |
| Normalized | correction_event | 90,135 | Amendment/correction signal |
| Analytical | issuer_origin_panel | 205,651 | Annual issuer-year modeling table |
| Analytical | filing_origin_panel | 21,832,838 | Filing-origin provenance table |
table_18_public_sample_attrition
- Claim. The public sample has an explicit sequential construction path and task-specific eligibility branches.
- Evidence. Generated Table 18 reports source, year, domestic-status, observability, and task-eligibility row counts with parent-relative attrition.
- Boundary. Task rows branch from the shared observable horizon and must not be read as sequential losses from one another.
Table: Public sample attrition and task eligibility
| Scope | Stage | Task | Rows | Dropped_From_Parent |
|---|---|---|---|---|
| sequential | source_issuer_origin | all | 205651 | 0 |
| sequential | fiscal_year_2011_2024 | all | 97028 | 108623 |
| sequential | 10-K/10-K/A with no observed same-year FPI-form proxy | all | 96828 | 200 |
| sequential | observable_365_day_horizon | all | 96734 | 94 |
| task | eligible_comment_thread | comment_thread | 96734 | 0 |
| task | eligible_amendment | amendment | 96734 | 0 |
| task | eligible_8k_402 | 8k_402 | 96734 | 0 |
Note: Sequential rows compare with the preceding sample-construction stage. Task rows branch from observable_365_day_horizon and therefore compare with that common observable parent rather than with one another. The 10-K/10-K/A same-year FPI-form proxy validates neither FPI status, domicile, nor US GAAP.
Public Cascade Readiness
| Field | Value |
|---|---|
| Main sample rows | 96,734 |
| Fiscal-year span | 2011-2024 |
| Sample proxy | 10-K/10-K/A with no observed same-year FPI-form proxy; validates neither FPI status, domicile, nor US GAAP |
| Task positive counts | {"8k_402": 2076, "amendment": 17927, "comment_thread": 26015} |
| Task exclusion counts | {"8k_402": 0, "amendment": 0, "comment_thread": 0} |
| Zero-positive tasks | none |
| Task status counts | {"fit": 576} |
| Readiness level | xbrl_ratio_baseline |
Public Cascade Fit and Skip Status
| Status | Reason | Rows |
|---|---|---|
fit |
576 |
Interpretation
Construction results document whether the public lake has enough coverage, nonzero positive labels, and feature-family availability to support the planned public-cascade experiments.
Results for Experiment 5: Public Cascade Prediction
This experiment estimates the filing-origin, submission-dated review-and-correction outcome state and compares the revision-frozen all + expanding headline with feature-family, window, calibration, selection, and peer-transfer sensitivity evidence.
table_03_public_task_metrics
- Claim. The revision-frozen primary specification produces above-prevalence ranking evidence for the three review-and-correction outcomes.
- Evidence. Generated Table 3 owns the
all + expandingprimary rows and reports PR-AUC, ROC-AUC, fold support, calibration diagnostics, and prevalence by task. - Boundary. Weak Brier Skill Score and ECE keep the claim to ranking/prioritization rather than calibrated probability rules.
Table: Public cascade task metrics
| Task | Panel_Positives | n_folds | valid_folds | Mean_Prevalence | Mean_PR_AUC | PR_AUC_Dispersion | Mean_ROC_AUC | Mean_Brier | Mean_Brier_Skill | Mean_ECE |
|---|---|---|---|---|---|---|---|---|---|---|
| comment_thread | 14,327 | 8 | 8 | 0.2610 | 0.4276 | [0.3847, 0.4706] | 0.6973 | 0.2088 | -0.0882 | 0.1793 |
| amendment | 8,415 | 8 | 8 | 0.1540 | 0.3385 | [0.3060, 0.3711] | 0.7183 | 0.1630 | -0.2646 | 0.1993 |
| 8k_402 | 1,219 | 8 | 8 | 0.0219 | 0.0603 | [0.0271, 0.0934] | 0.7532 | 0.1007 | -5.5151 | 0.2192 |
Note: PR-AUC dispersion entries are descriptive fold-dispersion intervals over annual out-of-time test folds after excluding sparse folds with fewer than 10 positives. Rolling and expanding training windows overlap, so the intervals describe evaluation-period dispersion rather than independent sampling uncertainty, superpopulation confidence intervals, or causal inference uncertainty. Table 3 and Figure 1 report only the revision-frozen all + expanding primary specification. Public-side holdouts are complete origin-calendar years. Training rows come only from origin years whose 365-day outcomes are fully mature before the holdout year begins. The evaluation unit is a public-cascade task summarized over these holdouts at the issuer-CIK filing-origin grain. Panel positives sum exact positive_test support over the one-to-one fit-owner rows, while mean prevalence is averaged over the reported task-window-feature evaluations; it should not be read as positives divided by a single manuscript-wide denominator. Brier Skill Score is measured relative to the corresponding prevalence-only Brier baseline. ECE is a 10-bin uniform-width calibration diagnostic from raw probability scores. Weak calibration should be read as evidence against using the scores as calibrated decision rules, not against the paper's ranking estimand.
table_04_feature_family_metrics
- Claim. Feature-family comparisons provide sensitivity evidence around the frozen primary public specification.
- Evidence. Feature counts and PR-AUC dispersion are shown across the configured public feature-family grid.
- Boundary. Feature-family summaries are aggregation evidence and should not be read as causal source dominance.
Table: Public cascade feature-family metrics
| Feature_Set | Features | XBRL_Ratios | XBRL_Coverage | Best_Window | n_folds | valid_folds | Mean_PR_AUC | PR_AUC_Dispersion | Mean_ROC_AUC |
|---|---|---|---|---|---|---|---|---|---|
| All | 74 | 11 | 15 | expanding | 8 | 8 | 0.2742 | [0.2585, 0.2899] | 0.7197 |
| Metadata | 23 | 0 | 0 | expanding | 8 | 8 | 0.2551 | [0.2399, 0.2702] | 0.6885 |
| Visibility history | 21 | 0 | 0 | rolling_5y | 8 | 8 | 0.2513 | [0.2358, 0.2667] | 0.6810 |
| XBRL | 42 | 11 | 15 | rolling_5y | 8 | 8 | 0.2195 | [0.2004, 0.2386] | 0.6483 |
| Prior-filing history | 1 | 0 | 0 | rolling_7y | 8 | 8 | 0.1589 | [0.1509, 0.1670] | 0.5307 |
| Auditor | 6 | 0 | 0 | rolling_5y | 8 | 8 | 0.1513 | [0.1449, 0.1578] | 0.5063 |
Note: PR-AUC dispersion entries are descriptive fold-dispersion intervals over annual out-of-time test folds after excluding sparse folds with fewer than 10 positives. Rolling and expanding training windows overlap, so the intervals describe evaluation-period dispersion rather than independent sampling uncertainty, superpopulation confidence intervals, or causal inference uncertainty. Entries are feature-family summaries over public-cascade task-window evaluations, not issuer-year sample sizes. Task-specific base-rate context is reported in the task tables. Note/disclosure-breadth variables enter the all-feature information set but are not reported as a standalone family row. Best-window entries are descriptive configuration summaries, not headline model-selection claims.
table_07_public_peer_metrics
- Claim. Peer-compatible families also rank review-and-correction outcomes under the submission-dated estimand.
- Evidence. Peer-family PR-AUC and ROC-AUC are reported under the same outcome design.
- Boundary. These values are within-outcome diagnostics, not cross-estimand superiority claims.
Table: Review-and-correction peer-compatible model-family metrics
| Model | n_folds | valid_folds | Mean_PR_AUC | PR_AUC_Dispersion | Mean_ROC_AUC |
|---|---|---|---|---|---|
| bao_inspired_tree_ensemble | 8 | 8 | 0.2163 | [0.2053, 0.2273] | 0.6319 |
| bertomeu_style_xgb | 8 | 8 | 0.2162 | [0.2050, 0.2274] | 0.6317 |
| perols_bagged | 8 | 8 | 0.2061 | [0.1947, 0.2175] | 0.6200 |
| perols_stacking | 8 | 8 | 0.1985 | [0.1857, 0.2114] | 0.6034 |
| perols_mlp | 8 | 8 | 0.1976 | [0.1821, 0.2130] | 0.6043 |
| perols_entropy_tree | 8 | 8 | 0.1932 | [0.1833, 0.2031] | 0.6016 |
| perols_linear_svm | 8 | 8 | 0.1928 | [0.1776, 0.2080] | 0.6024 |
| perols_logit | 8 | 8 | 0.1915 | [0.1782, 0.2049] | 0.5979 |
| dechow_public_xbrl_proxy_logit | 8 | 8 | 0.1622 | [0.1523, 0.1721] | 0.5169 |
Note: PR-AUC dispersion entries are descriptive fold-dispersion intervals over annual out-of-time test folds after excluding sparse folds with fewer than 10 positives. Rolling and expanding training windows overlap, so the intervals describe evaluation-period dispersion rather than independent sampling uncertainty, superpopulation confidence intervals, or causal inference uncertainty. Peer-compatible families are ranking checks under transferred model vocabularies, not calibrated probability comparisons or original-paper replications. Peer-model folds and public-cascade folds can cover different historical sequences, so dispersion widths should not be compared across evidence layers.
table_13_public_fold_support
- Claim. Annual outcome test folds have sufficient positive support for reported dispersion summaries.
- Evidence. Task-year rows, positives, prevalence, and sparse-fold flags are reported.
- Boundary. Fold support makes dispersion auditable; it does not remove class-imbalance or calibration concerns.
Table: Origin-calendar-year outcome fold support
| Task | Test_Year | Configs | Test_Rows | Positives | Prevalence | Sparse_Excluded |
|---|---|---|---|---|---|---|
| 8k_402 | 2017 | 24 | 6,502 | 96 | 0.0148 | No |
| 8k_402 | 2018 | 24 | 6,651 | 86 | 0.0129 | No |
| 8k_402 | 2019 | 24 | 6,615 | 53 | 0.0080 | No |
| 8k_402 | 2020 | 24 | 6,531 | 70 | 0.0107 | No |
| 8k_402 | 2021 | 24 | 7,018 | 439 | 0.0626 | No |
| 8k_402 | 2022 | 24 | 7,642 | 154 | 0.0202 | No |
| 8k_402 | 2023 | 24 | 7,187 | 178 | 0.0248 | No |
| 8k_402 | 2024 | 24 | 6,741 | 143 | 0.0212 | No |
| amendment | 2017 | 24 | 6,502 | 1,061 | 0.1632 | No |
| amendment | 2018 | 24 | 6,651 | 1,147 | 0.1725 | No |
| amendment | 2019 | 24 | 6,615 | 1,141 | 0.1725 | No |
| amendment | 2020 | 24 | 6,531 | 1,069 | 0.1637 | No |
| amendment | 2021 | 24 | 7,018 | 1,199 | 0.1708 | No |
| amendment | 2022 | 24 | 7,642 | 950 | 0.1243 | No |
| amendment | 2023 | 24 | 7,187 | 959 | 0.1334 | No |
| amendment | 2024 | 24 | 6,741 | 889 | 0.1319 | No |
| comment_thread | 2017 | 24 | 6,502 | 1,942 | 0.2987 | No |
| comment_thread | 2018 | 24 | 6,651 | 1,647 | 0.2476 | No |
| comment_thread | 2019 | 24 | 6,615 | 1,537 | 0.2324 | No |
| comment_thread | 2020 | 24 | 6,531 | 1,691 | 0.2589 | No |
| comment_thread | 2021 | 24 | 7,018 | 1,653 | 0.2355 | No |
| comment_thread | 2022 | 24 | 7,642 | 2,091 | 0.2736 | No |
| comment_thread | 2023 | 24 | 7,187 | 1,895 | 0.2637 | No |
| comment_thread | 2024 | 24 | 6,741 | 1,871 | 0.2776 | No |
Note: Entries report complete origin-calendar-year test support collapsed across configurations because test rows and positive counts are task-year properties. Sparse folds are those with fewer than 10 positives; such folds are excluded from formal fold-dispersion intervals.
table_14_task_feature_family_metrics
- Claim. Task-level feature-family rankings provide sensitivity evidence around the frozen primary rows.
- Evidence. Task-by-feature-family PR-AUC, ROC-AUC, calibration diagnostics, and fold support are reported across the configured grid.
- Boundary. Use this table for label-specific prose rather than a single global feature-family ranking.
Table: Task-by-feature-family public-cascade metrics
| Task | Feature_Set | n_folds | valid_folds | Mean_Prevalence | Mean_PR_AUC | PR_AUC_Dispersion | Mean_ROC_AUC | Mean_Brier_Skill | Mean_ECE |
|---|---|---|---|---|---|---|---|---|---|
| 8k_402 | All | 8 | 8 | 0.0219 | 0.0554 | [0.0311, 0.0796] | 0.7458 | -5.2284 | 0.2107 |
| 8k_402 | Visibility history | 8 | 8 | 0.0219 | 0.0500 | [0.0230, 0.0770] | 0.6898 | -7.3510 | 0.2713 |
| 8k_402 | Metadata | 8 | 8 | 0.0219 | 0.0456 | [0.0284, 0.0627] | 0.7038 | -6.4330 | 0.2577 |
| 8k_402 | XBRL | 8 | 8 | 0.0219 | 0.0422 | [0.0256, 0.0589] | 0.6537 | -8.0766 | 0.2920 |
| 8k_402 | Auditor | 8 | 8 | 0.0219 | 0.0279 | [0.0106, 0.0452] | 0.5076 | -15.9790 | 0.4741 |
| 8k_402 | Prior-filing history | 8 | 8 | 0.0219 | 0.0238 | [0.0090, 0.0386] | 0.5193 | -13.8918 | 0.4318 |
| amendment | All | 8 | 8 | 0.1540 | 0.3383 | [0.3067, 0.3699] | 0.7159 | -0.3199 | 0.2124 |
| amendment | Metadata | 8 | 8 | 0.1540 | 0.3341 | [0.3090, 0.3593] | 0.7012 | -0.3208 | 0.2152 |
| amendment | Visibility history | 8 | 8 | 0.1540 | 0.3337 | [0.3114, 0.3561] | 0.7044 | -0.4478 | 0.2502 |
| amendment | XBRL | 8 | 8 | 0.1540 | 0.2274 | [0.2006, 0.2542] | 0.6307 | -0.6914 | 0.2872 |
| amendment | Prior-filing history | 8 | 8 | 0.1540 | 0.1726 | [0.1504, 0.1948] | 0.5305 | -0.9316 | 0.3408 |
| amendment | Auditor | 8 | 8 | 0.1540 | 0.1641 | [0.1595, 0.1687] | 0.5146 | -0.9756 | 0.3526 |
| comment_thread | All | 8 | 8 | 0.2610 | 0.4289 | [0.3868, 0.4710] | 0.6974 | -0.0929 | 0.1813 |
| comment_thread | XBRL | 8 | 8 | 0.2610 | 0.3888 | [0.3380, 0.4396] | 0.6604 | -0.2583 | 0.2420 |
| comment_thread | Metadata | 8 | 8 | 0.2610 | 0.3855 | [0.3506, 0.4204] | 0.6605 | -0.1117 | 0.1749 |
| comment_thread | Visibility history | 8 | 8 | 0.2610 | 0.3701 | [0.3327, 0.4074] | 0.6489 | -0.1796 | 0.2049 |
| comment_thread | Prior-filing history | 8 | 8 | 0.2610 | 0.2804 | [0.2581, 0.3028] | 0.5422 | -0.3229 | 0.2456 |
| comment_thread | Auditor | 8 | 8 | 0.2610 | 0.2620 | [0.2417, 0.2822] | 0.4966 | -0.3037 | 0.2374 |
Note: PR-AUC dispersion entries are descriptive fold-dispersion intervals over annual out-of-time test folds after excluding sparse folds with fewer than 10 positives. Rolling and expanding training windows overlap, so the intervals describe evaluation-period dispersion rather than independent sampling uncertainty, superpopulation confidence intervals, or causal inference uncertainty. Entries are task-by-feature-family averages over the configured public-cascade training windows. They clarify the aggregation behind the feature-family summary and should be read as information-set evidence, not causal decomposition.
table_17_selection_profile
- Claim. Recorded outcomes partly reflect selected scrutiny and issuer visibility states.
- Evidence. Outcome rates are profiled across filing size, XBRL assets, filing history, prior correspondence, form type, and FPI proxy strata.
- Boundary. This descriptive profile is not a causal SEC-selection correction.
Table: Selection-aware outcome profile
| Stratum | Group | Issuer_Years | Comment_Rate | Amendment_Rate | Item_4_02_Rate |
|---|---|---|---|---|---|
| Filing size | Below median (1,855,960) | 99,609 | 0.1117 | 0.2538 | 0.0169 |
| Filing size | At/above median (1,855,960) | 99,610 | 0.2951 | 0.1914 | 0.0251 |
| XBRL log assets | Below median (19.6571) | 40,281 | 0.2939 | 0.2388 | 0.0318 |
| XBRL log assets | At/above median (19.6571) | 40,282 | 0.2961 | 0.1192 | 0.0134 |
| Prior filing count | Below median (113) | 99,547 | 0.1117 | 0.2356 | 0.0169 |
| Prior filing count | At/above median (113) | 99,672 | 0.2950 | 0.2096 | 0.0251 |
| Days since prior filing | Below median (13.0000) | 97,682 | 0.2701 | 0.2164 | 0.0247 |
| Days since prior filing | At/above median (13.0000) | 100,642 | 0.1402 | 0.2283 | 0.0176 |
| Prior correspondence-thread history | No prior 3y correspondence thread | 113,956 | 0.1034 | 0.2147 | 0.0136 |
| Prior correspondence-thread history | Any prior 3y correspondence thread | 85,263 | 0.3370 | 0.2331 | 0.0309 |
| Annual form | 10-K | 196,919 | 0.2051 | 0.2206 | 0.0211 |
| Annual form | 10-K/A | 2,300 | 0.0587 | 0.3943 | 0.0126 |
| Observed same-year FPI-form indicator | No observed 20-F/40-F/6-K | 198,910 | 0.2031 | 0.2225 | 0.0210 |
| Observed same-year FPI-form indicator | Observed 20-F/40-F/6-K | 309 | 0.3722 | 0.3139 | 0.0324 |
Note: Issuer_Years are descriptive strata from the existing public issuer-origin panel. They show how outcome rates vary with filing visibility, history, and issuer profile variables. Parenthetical values in group labels are split thresholds, not sample sizes; XBRL log-asset strata are limited to observations with available XBRL asset values; days since prior filing refers to any prior EDGAR filing, not only a prior annual report. The observed same-year FPI-form indicator records whether a 20-F, 40-F, or 6-K is observed for the issuer fiscal year; it does not validate FPI status or domicile. The table is selection-aware evidence, not a causal adjustment model or proof that SEC scrutiny selection has been solved. Prior comment-thread strata use eventually disclosed correspondence submission dates; those history fields are excluded from predictive models because release-time availability at the filing origin is not verified.
Review-and-correction outcome PR-AUC
- Claim. The revision-frozen primary specification ranks later review-and-correction outcomes above task prevalence.
- Evidence. Figure 1 receives only the declared
all + expandingrows also owned by generated Table 3. - Boundary. This is ranking evidence, not calibrated deployment evidence; Brier Skill Score and ECE remain the calibration gate.
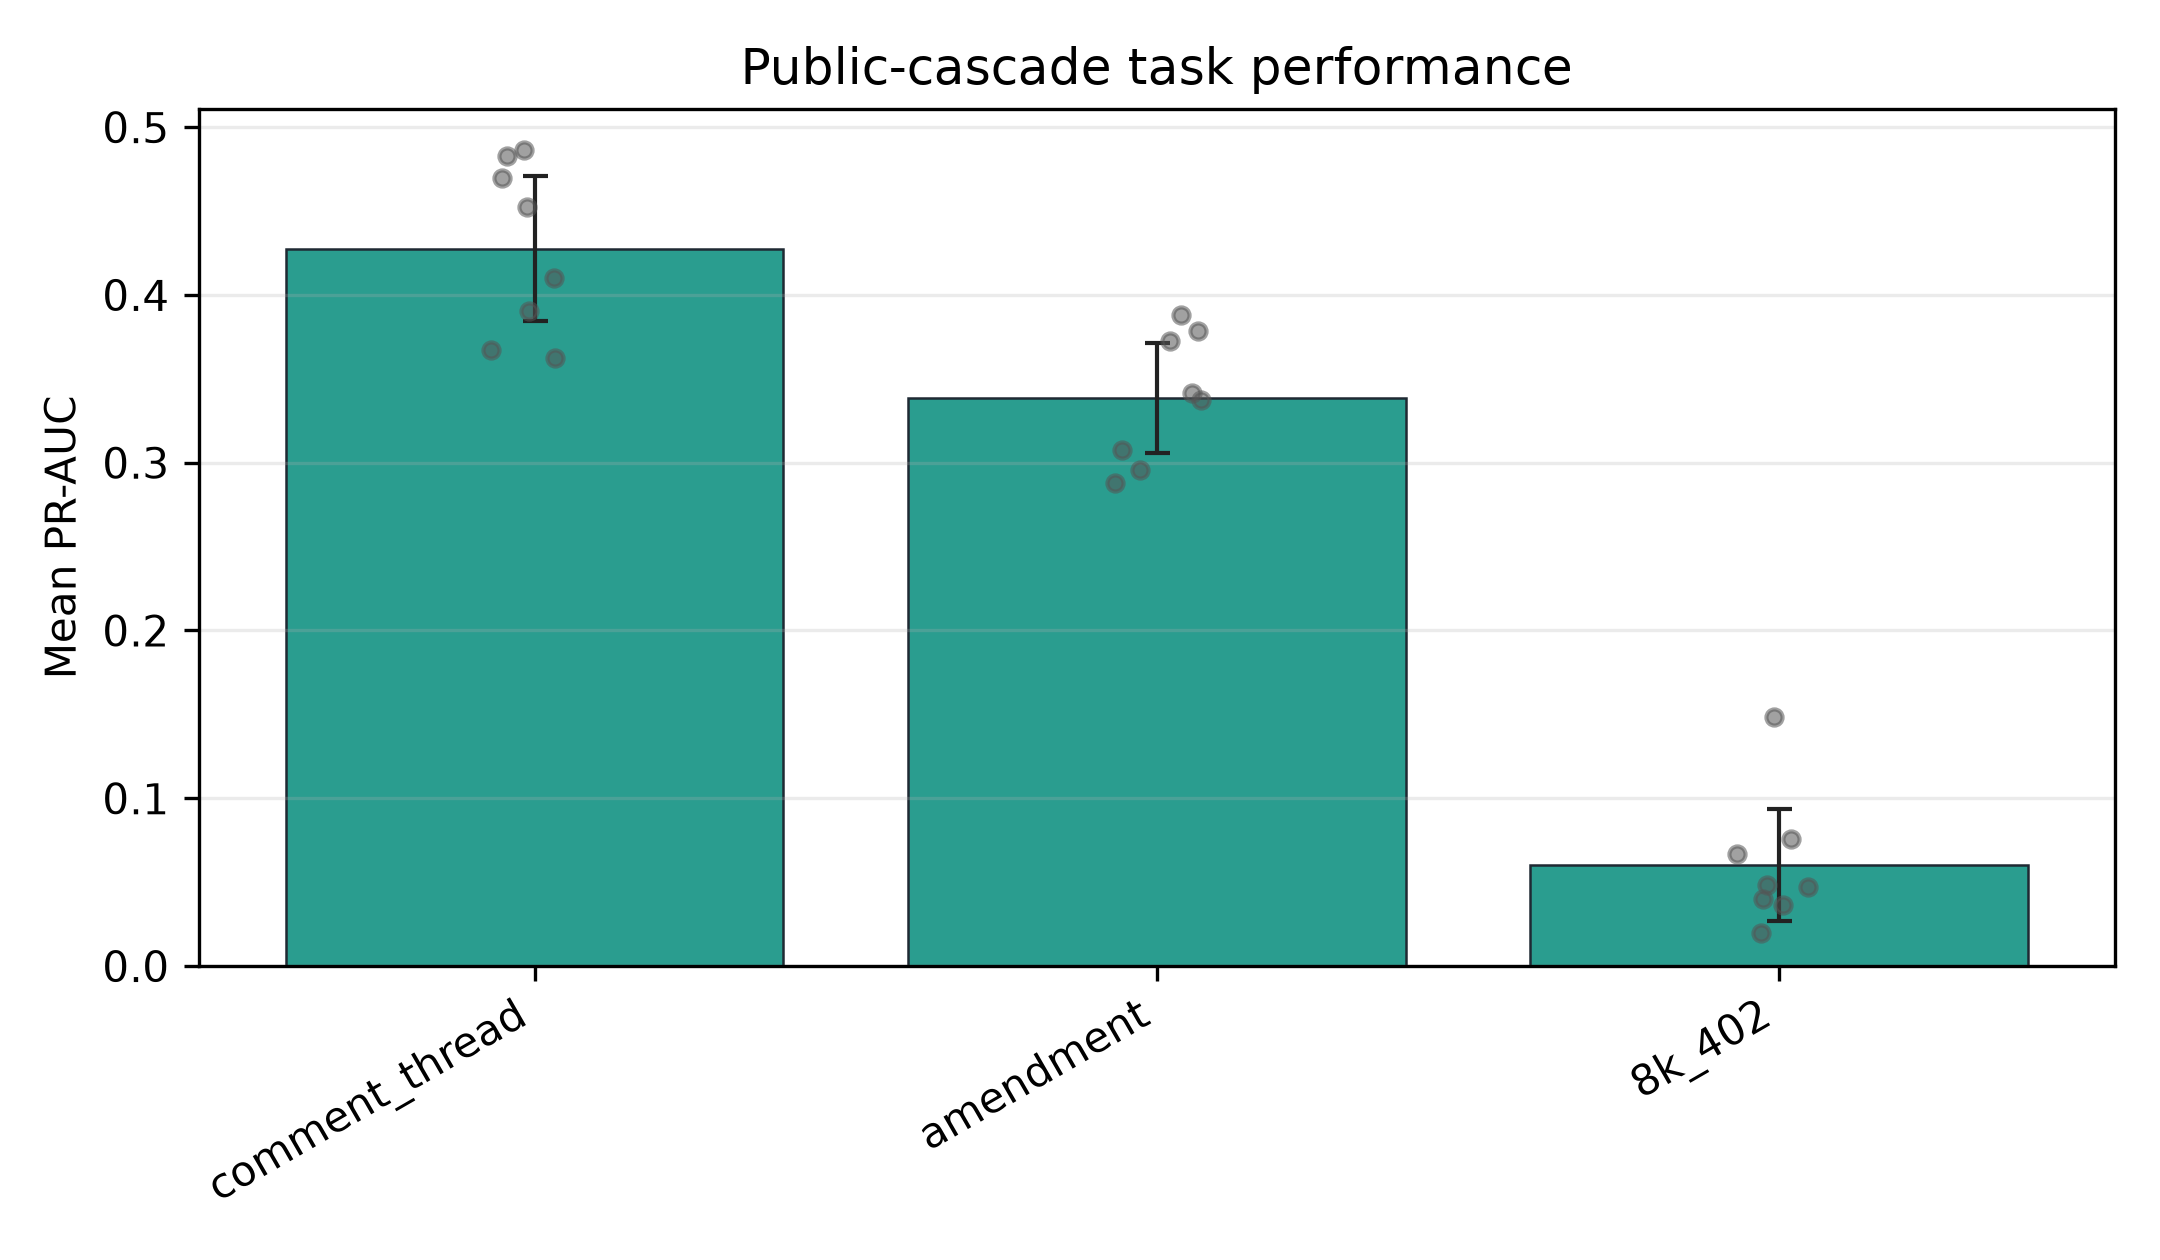
Figure note. Colored bars or dots encode mean PR-AUC; grey points encode valid annual test folds; capped black lines encode descriptive fold-dispersion intervals.
Feature-family PR-AUC
- Claim. Feature-family comparisons provide sensitivity evidence around the frozen outcome specification.
- Evidence. The figure compares all-feature, metadata, XBRL, auditor, Prior-filing history (legacy artifact key: oversight), and visibility/history information sets under the same outcome evaluation frame.
- Boundary. Interpret as information-set evidence rather than a structural source-importance or mechanism claim.
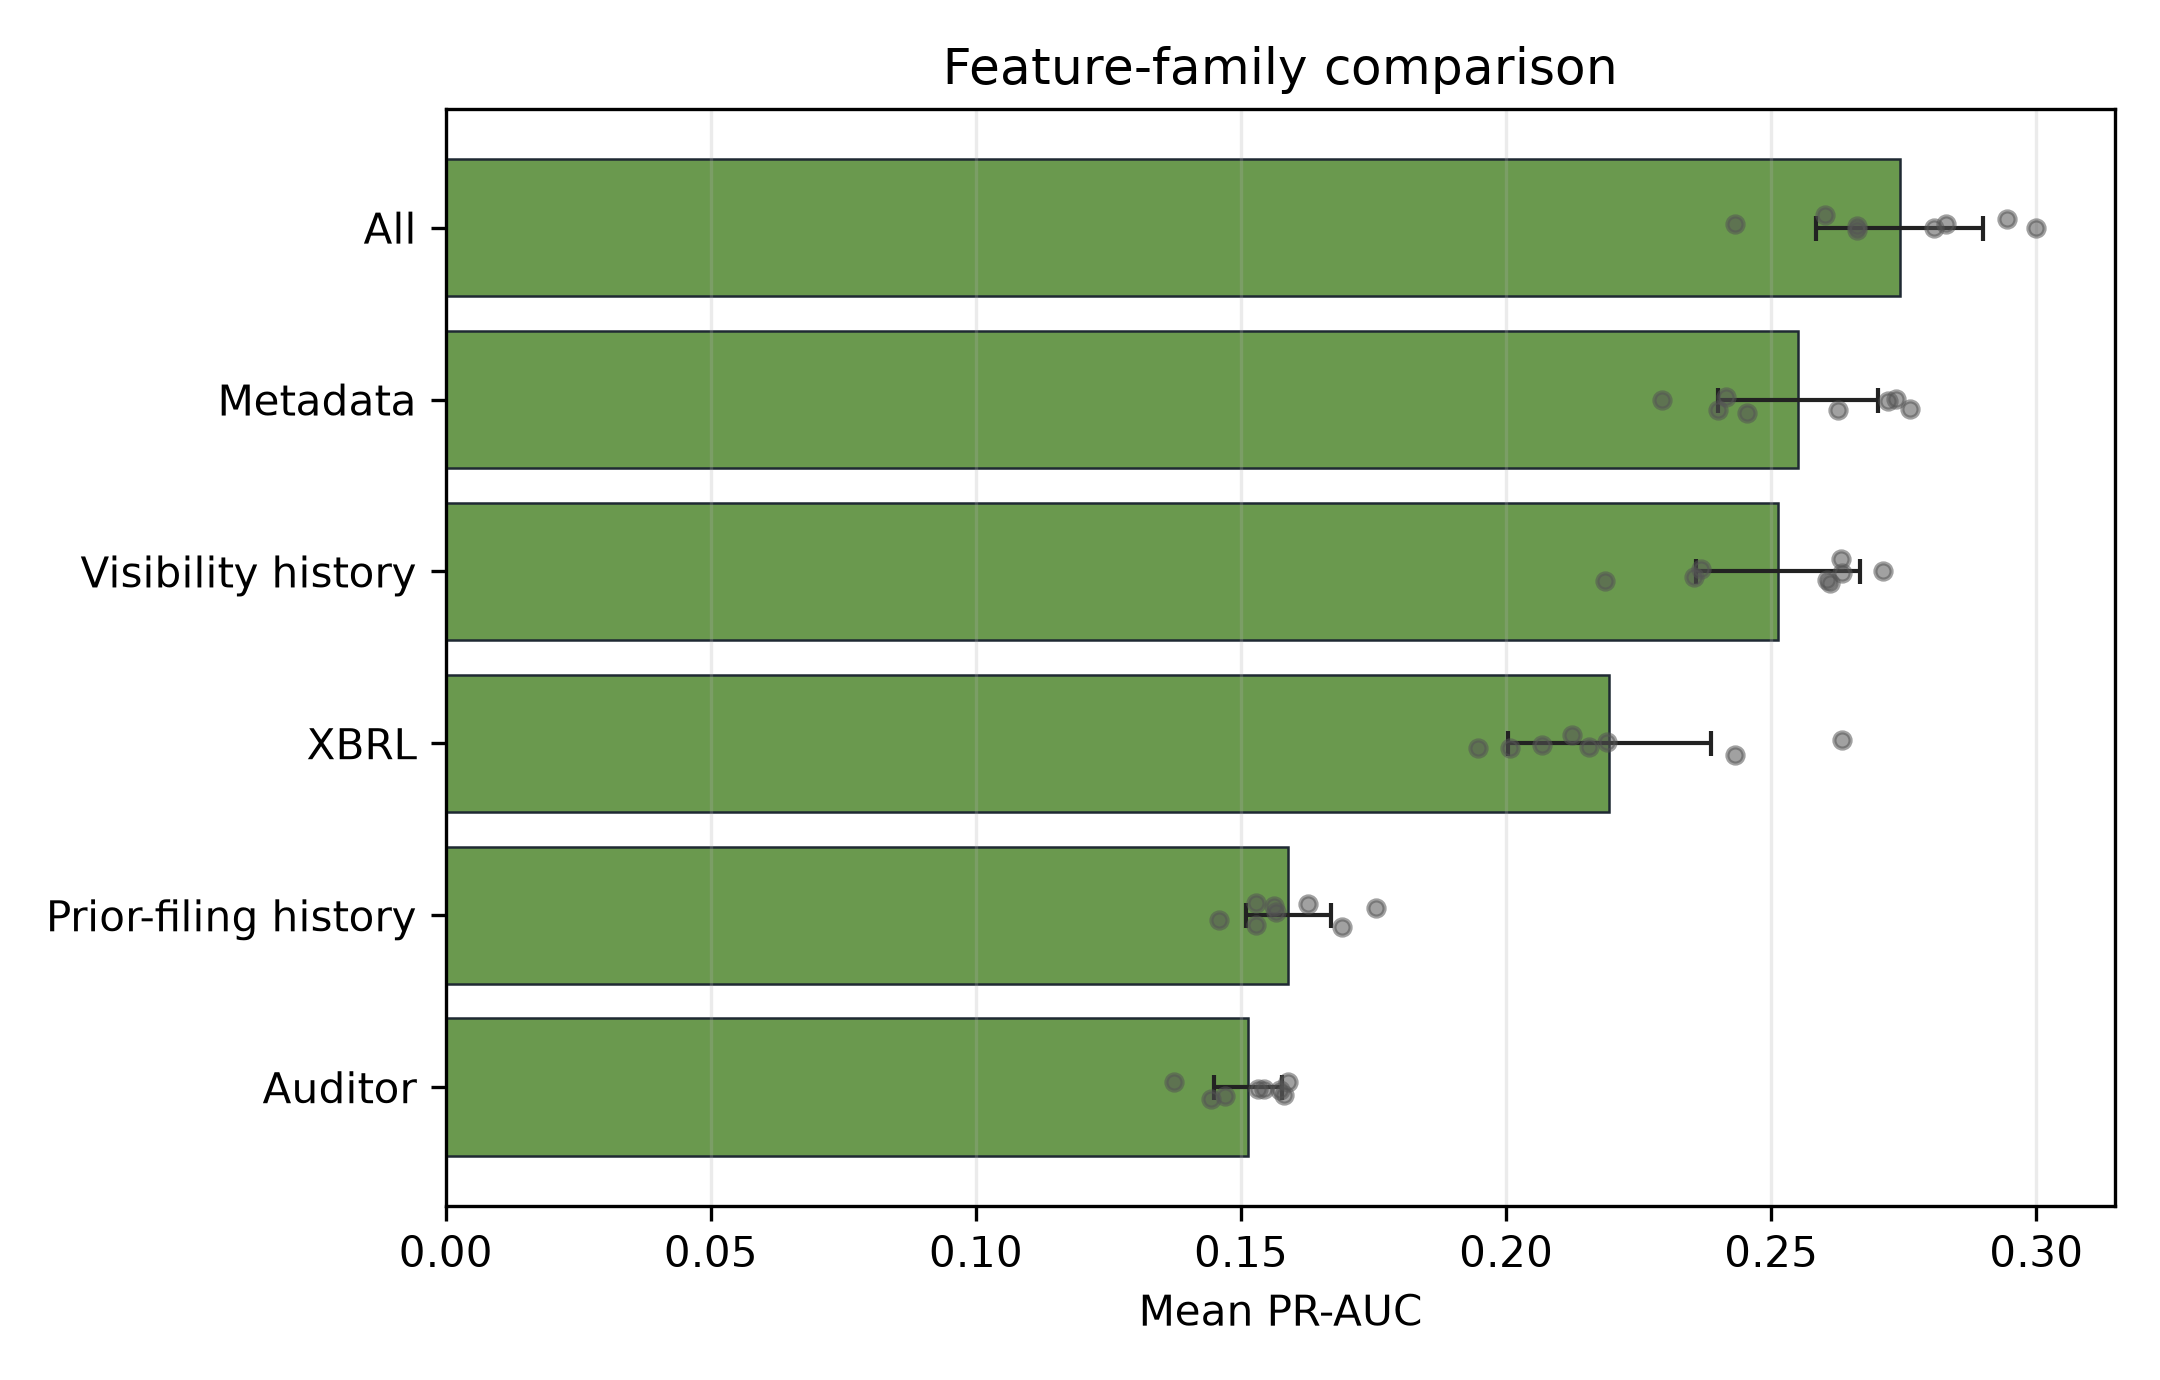
Figure note. Colored bars or dots encode mean PR-AUC; grey points encode valid annual test folds; capped black lines encode descriptive fold-dispersion intervals.
Review-and-correction peer-family PR-AUC
- Claim. Familiar accounting ML model-family vocabularies can be evaluated on the review-and-correction outcomes.
- Evidence. The figure moves the peer-compatible families to the outcome task and keeps the metric vocabulary comparable.
- Boundary. Do not compare these values as same-estimand superiority over detected-misstatement studies.
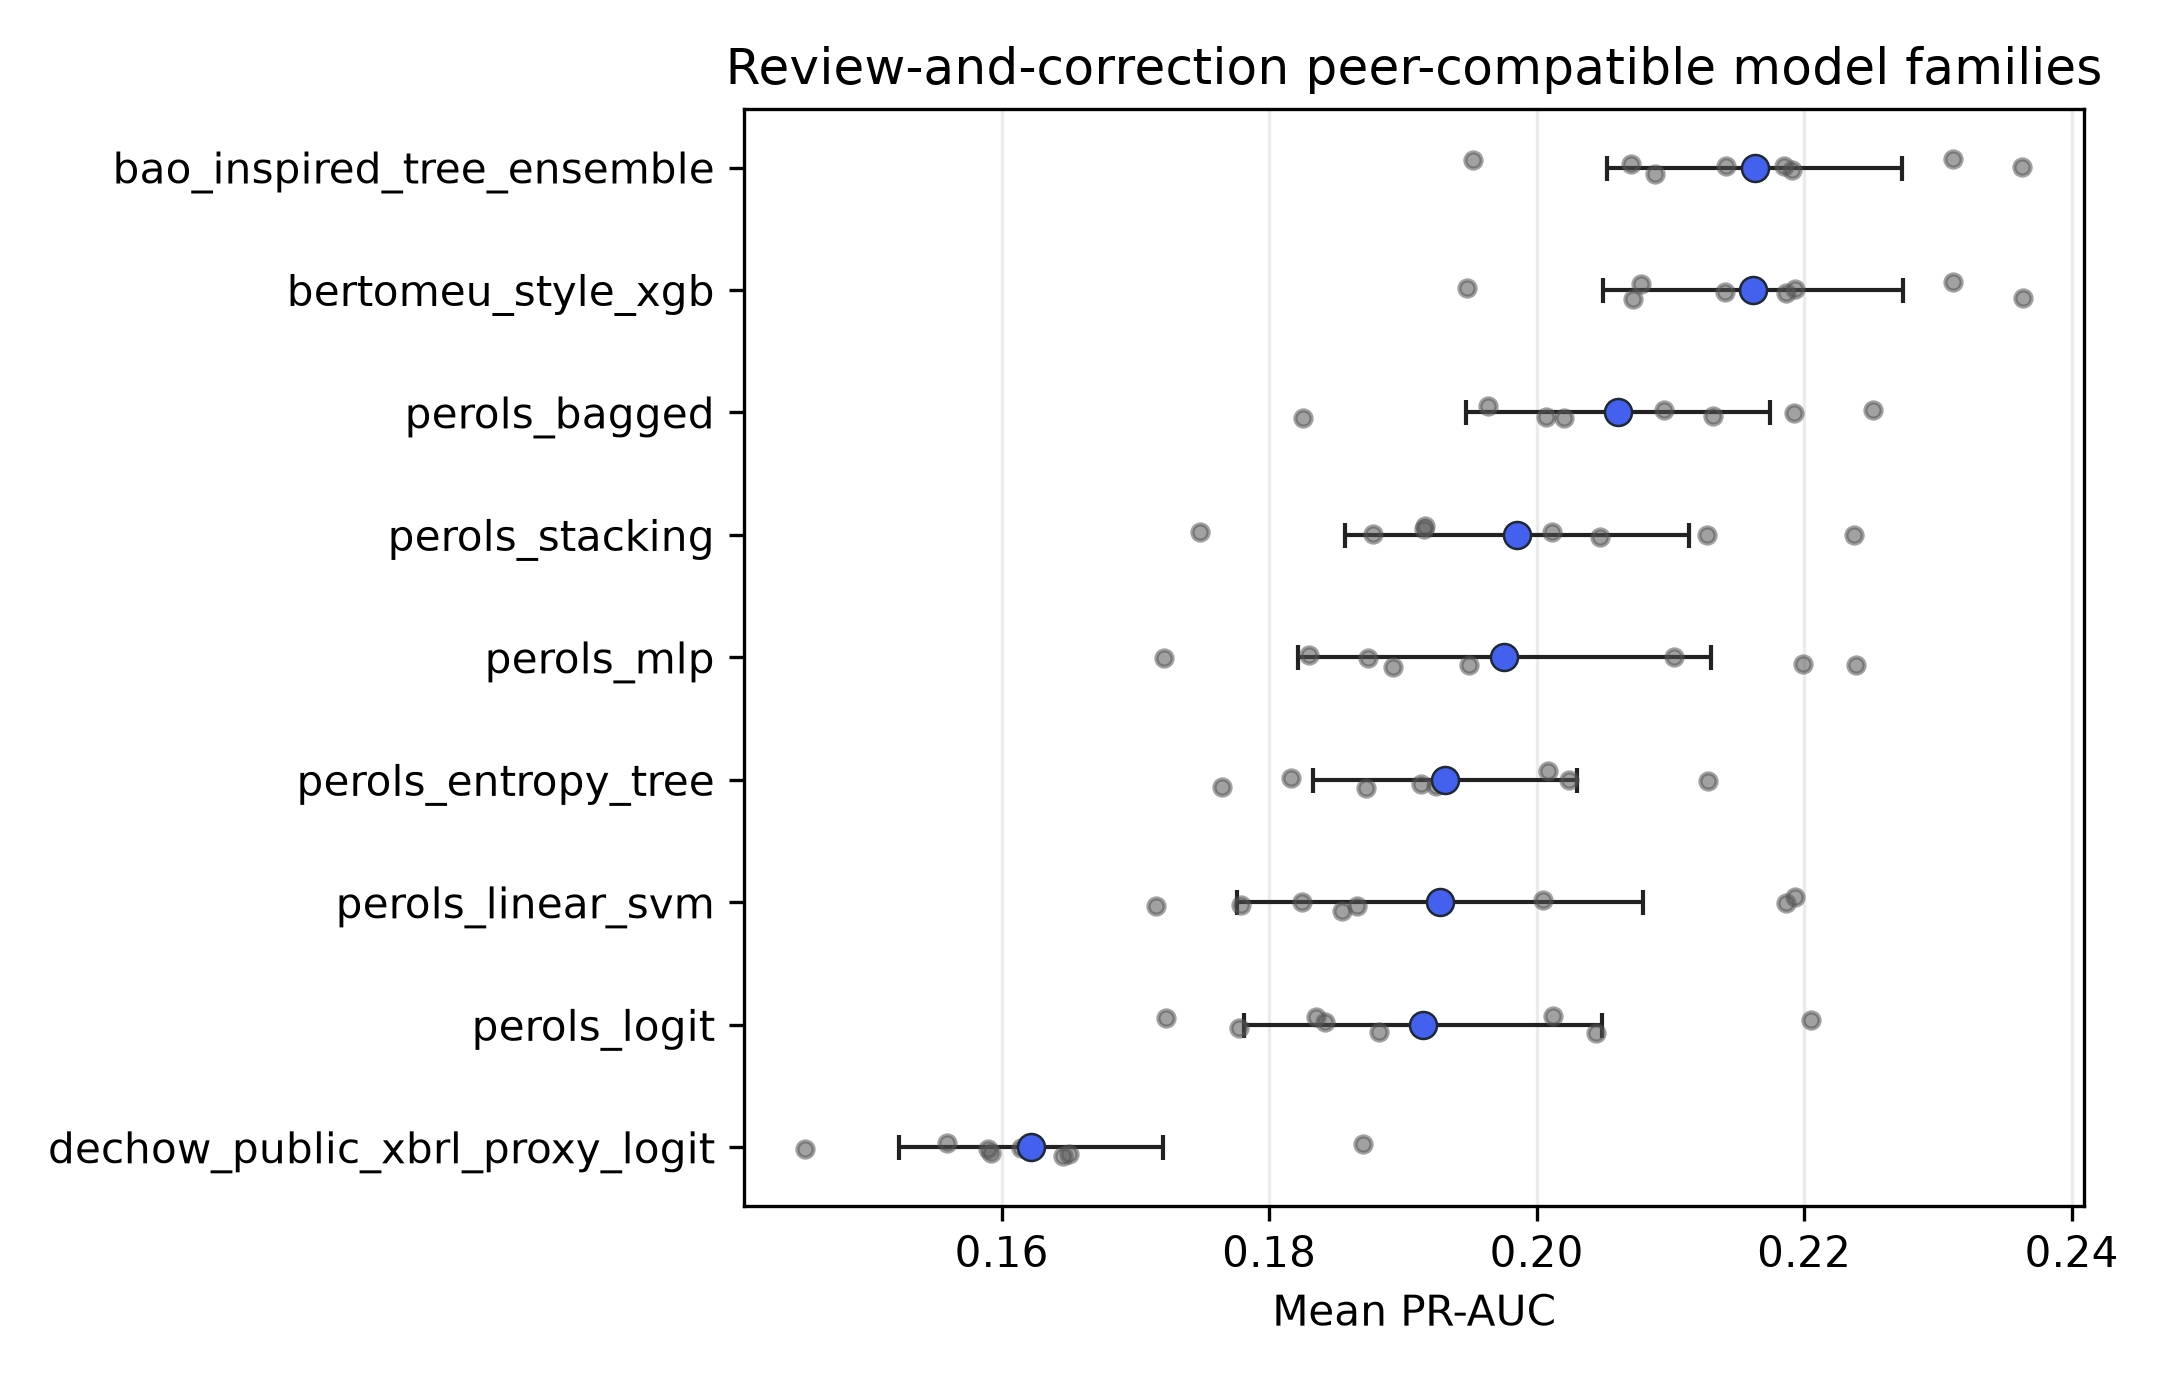
Figure note. Colored bars or dots encode mean PR-AUC; grey points encode valid annual test folds; capped black lines encode descriptive fold-dispersion intervals.
Public Peer Task Summary
| Task | Metric rows | Mean prevalence | Mean PR-AUC | Mean ROC-AUC |
|---|---|---|---|---|
comment_thread |
1,248 | 0.2604 | 0.3248 | 0.5905 |
amendment |
1,248 | 0.1533 | 0.2331 | 0.6105 |
8k_402 |
1,248 | 0.0223 | 0.0422 | 0.6266 |
Public Peer Fit and Skip Status
| Status | Reason | Rows |
|---|---|---|
fit |
fit |
3,744 |
skipped |
missing_required_mapping |
480 |
skipped |
one_class_train_or_empty_features |
192 |
Interpretation
Prediction results should be read within each label, prevalence, feature family, training window, and model-family mapping. Public peer rows provide model-language transfer evidence, not same-estimand superiority over the detected-misstatement literature. Alternative configurations remain sensitivity evidence rather than headline selections.
Results for Experiment 6: Detected-Misstatement Benchmark and Public Cascade Overlap
This experiment is the integrated-paper gate. The current bridge is the confirmed WRDS SEC Analytics Suite CIK-GVKEY link export, used as a raw-only gvkey-CIK-year bridge.
table_08_bridge_coverage
- Claim. The bridge covers most benchmark rows and firms before overlap claims are made.
- Evidence. Row, firm, and positive-row coverage are reported for the raw-only WRDS gvkey-CIK-year bridge.
- Boundary. Construct-overlap claims remain bounded to matched bridge rows.
Table: Bridge coverage
| Metric | Value |
|---|---|
| raw_rows | 82,908 |
| raw_firms | 9,156 |
| matched_raw_rows | 79,273 |
| matched_raw_firms | 8,758 |
| row_coverage_rate | 0.9562 |
| firm_coverage_rate | 0.9565 |
| raw_positive_rows | 2,460 |
| matched_positive_rows | 2,337 |
Note: These rates describe raw CIK-GVKEY bridge availability. Construct-overlap claims use the narrower high-confidence sample reported in the bridge-overlap sample-boundaries appendix table.
table_09_construct_alignment
- Claim. Public scores and detected-misstatement scores show reciprocal severe-tail enrichment under the bridge gate.
- Evidence. Generated Table 9 is the sole owner of the two declared primary alignment rows and their top-decile lift, precision, FDR, and bootstrap intervals.
- Boundary. Lift above one supports enrichment, while low absolute precision and high FDR rule out event-identification claims.
Table: Construct-overlap ranking alignment
| Direction | Model | Target | Feature_Set | Window | N | Positives | Top_10pct_K | Top_10pct_Hits | PR_AUC | Top_Decile_Lift | Top_10pct_Precision | Top_10pct_FDR | Lift_Bootstrap_Interval | Bootstrap_Issuers | Confidence_Tier |
|---|---|---|---|---|---|---|---|---|---|---|---|---|---|---|---|
| Public score to benchmark positives | public_cascade | Item 4.02 | all | expanding | 10,828 | 127 | 1,083 | 48 | 0.0423 | 3.7788 | 0.0443 | 0.9557 | [2.8664, 4.7039] | 3,410 | high_confidence |
| Detected-misstatement score to recorded outcomes | benchmark_xgb | Item 4.02 | benchmark_all | expanding | 31,909 | 507 | 3,191 | 134 | 0.0354 | 2.6429 | 0.0420 | 0.9580 | [2.2663, 3.0655] | 5,870 | high_confidence |
Note: Lift bootstrap intervals are issuer-cluster percentile bootstrap intervals from the bridge-gated artifacts, not annual fold-dispersion intervals. Bridge tier is wrds_validated, and displayed rows are restricted to high-confidence bridge rows. Top-10% precision and FDR report the absolute base-rate burden behind lift; the implicit bridge-sample base rate can differ from the full public-cascade task prevalence because of the high-confidence bridge restriction. These Item 4.02 rows are severe-tail diagnostics within the broader construct-validation case; they support related-construct enrichment rather than label equivalence.
table_15_bridge_overlap_matrix
- Claim. Recorded outcomes and detected-misstatement labels are related but not identical across bridge tiers.
- Evidence. The matrix reports benchmark/outcome rates, co-occurrence, and lifts by outcome and bridge tier.
- Boundary. The typed pattern is construct-validity evidence; it does not establish label equivalence.
Table: Bridge-gated outcome overlap matrix
| Public_Label | Bridge_Tier | Bridge_Rows | Benchmark_Positives | Public_Positives | Both_Positive | Benchmark_Rate | Public_Rate | Public_Rate_If_Benchmark_Pos | Benchmark_Rate_If_Public_Pos | Public_Lift_If_Benchmark_Pos | Benchmark_Lift_If_Public_Pos |
|---|---|---|---|---|---|---|---|---|---|---|---|
| comment_thread | high_confidence | 44,183 | 1,303 | 13,394 | 407 | 0.0295 | 0.3031 | 0.3124 | 0.0304 | 1.0304 | 1.0304 |
| comment_thread | ambiguous | 2,158 | 65 | 760 | 21 | 0.0301 | 0.3522 | 0.3231 | 0.0276 | 0.9174 | 0.9174 |
| comment_thread | all_matched | 46,341 | 1,368 | 14,154 | 428 | 0.0295 | 0.3054 | 0.3129 | 0.0302 | 1.0243 | 1.0243 |
| amendment | high_confidence | 44,183 | 1,303 | 9,373 | 532 | 0.0295 | 0.2121 | 0.4083 | 0.0568 | 1.9246 | 1.9246 |
| amendment | ambiguous | 2,158 | 65 | 470 | 28 | 0.0301 | 0.2178 | 0.4308 | 0.0596 | 1.9779 | 1.9779 |
| amendment | all_matched | 46,341 | 1,368 | 9,843 | 560 | 0.0295 | 0.2124 | 0.4094 | 0.0569 | 1.9273 | 1.9273 |
| 8k_402 | high_confidence | 44,183 | 1,303 | 1,025 | 258 | 0.0295 | 0.0232 | 0.1980 | 0.2517 | 8.5351 | 8.5351 |
| 8k_402 | ambiguous | 2,158 | 65 | 47 | 14 | 0.0301 | 0.0218 | 0.2154 | 0.2979 | 9.8894 | 9.8894 |
| 8k_402 | all_matched | 46,341 | 1,368 | 1,072 | 272 | 0.0295 | 0.0231 | 0.1988 | 0.2537 | 8.5951 | 8.5951 |
Note: Bridge_Rows are bridge-gated label-overlap diagnostics. The table reports absolute outcome and benchmark rates and lift for each recorded outcome by bridge tier. These descriptive rates broaden construct-validation evidence beyond the sparse Item 4.02 severe-tail ranking rows; they do not imply label equivalence.
table_16_bridge_sample_boundaries
- Claim. The bridge exercise has explicit covered, ambiguous, dropped, and unmatched sample boundaries.
- Evidence. Benchmark rows and positives are shown by bridge-overlap boundary.
- Boundary. Generalization beyond high-confidence mapped rows should be qualified.
Table: Bridge-overlap sample boundaries
| Boundary | Benchmark_Rows | Row_Share | Benchmark_Positives | Positive_Share | Interpretation |
|---|---|---|---|---|---|
| full_raw | 82,908 | 1.0000 | 2,460 | 1.0000 | Benchmark rows entering the bridge-overlap accounting screen |
| ambiguous | 2,158 | 0.0260 | 65 | 0.0264 | Mapped rows retained for sensitivity diagnostics, not headline overlap |
| dropped | 36,567 | 0.4411 | 1,092 | 0.4439 | Rows without a usable high-confidence public-side overlap match |
| high_confidence | 44,183 | 0.5329 | 1,303 | 0.5297 | Rows used for headline bridge-gated construct-alignment statistics |
Note: This table reports the construct-overlap sample boundary after bridge accounting, not the raw CIK-GVKEY coverage rate reported in the bridge-coverage table. Construct-overlap claims are bounded to high-confidence rows. Dropped rows define the generalizability boundary of the overlap exercise. An additional 3,635 raw benchmark rows lack a usable public-side identifier and are outside all overlap statistics.
Construct-overlap lift
- Claim. The WRDS-validated bridge supports related-but-non-identical overlap between the recorded outcomes and detected-misstatement labels.
- Evidence. Figure 5 receives exactly the two declared primary alignment rows owned by generated Table 9, alongside precision/FDR context in the table.
- Boundary. Item 4.02 lift is a severe-tail diagnostic, not the sole construct-validity basis or event-identification proof.
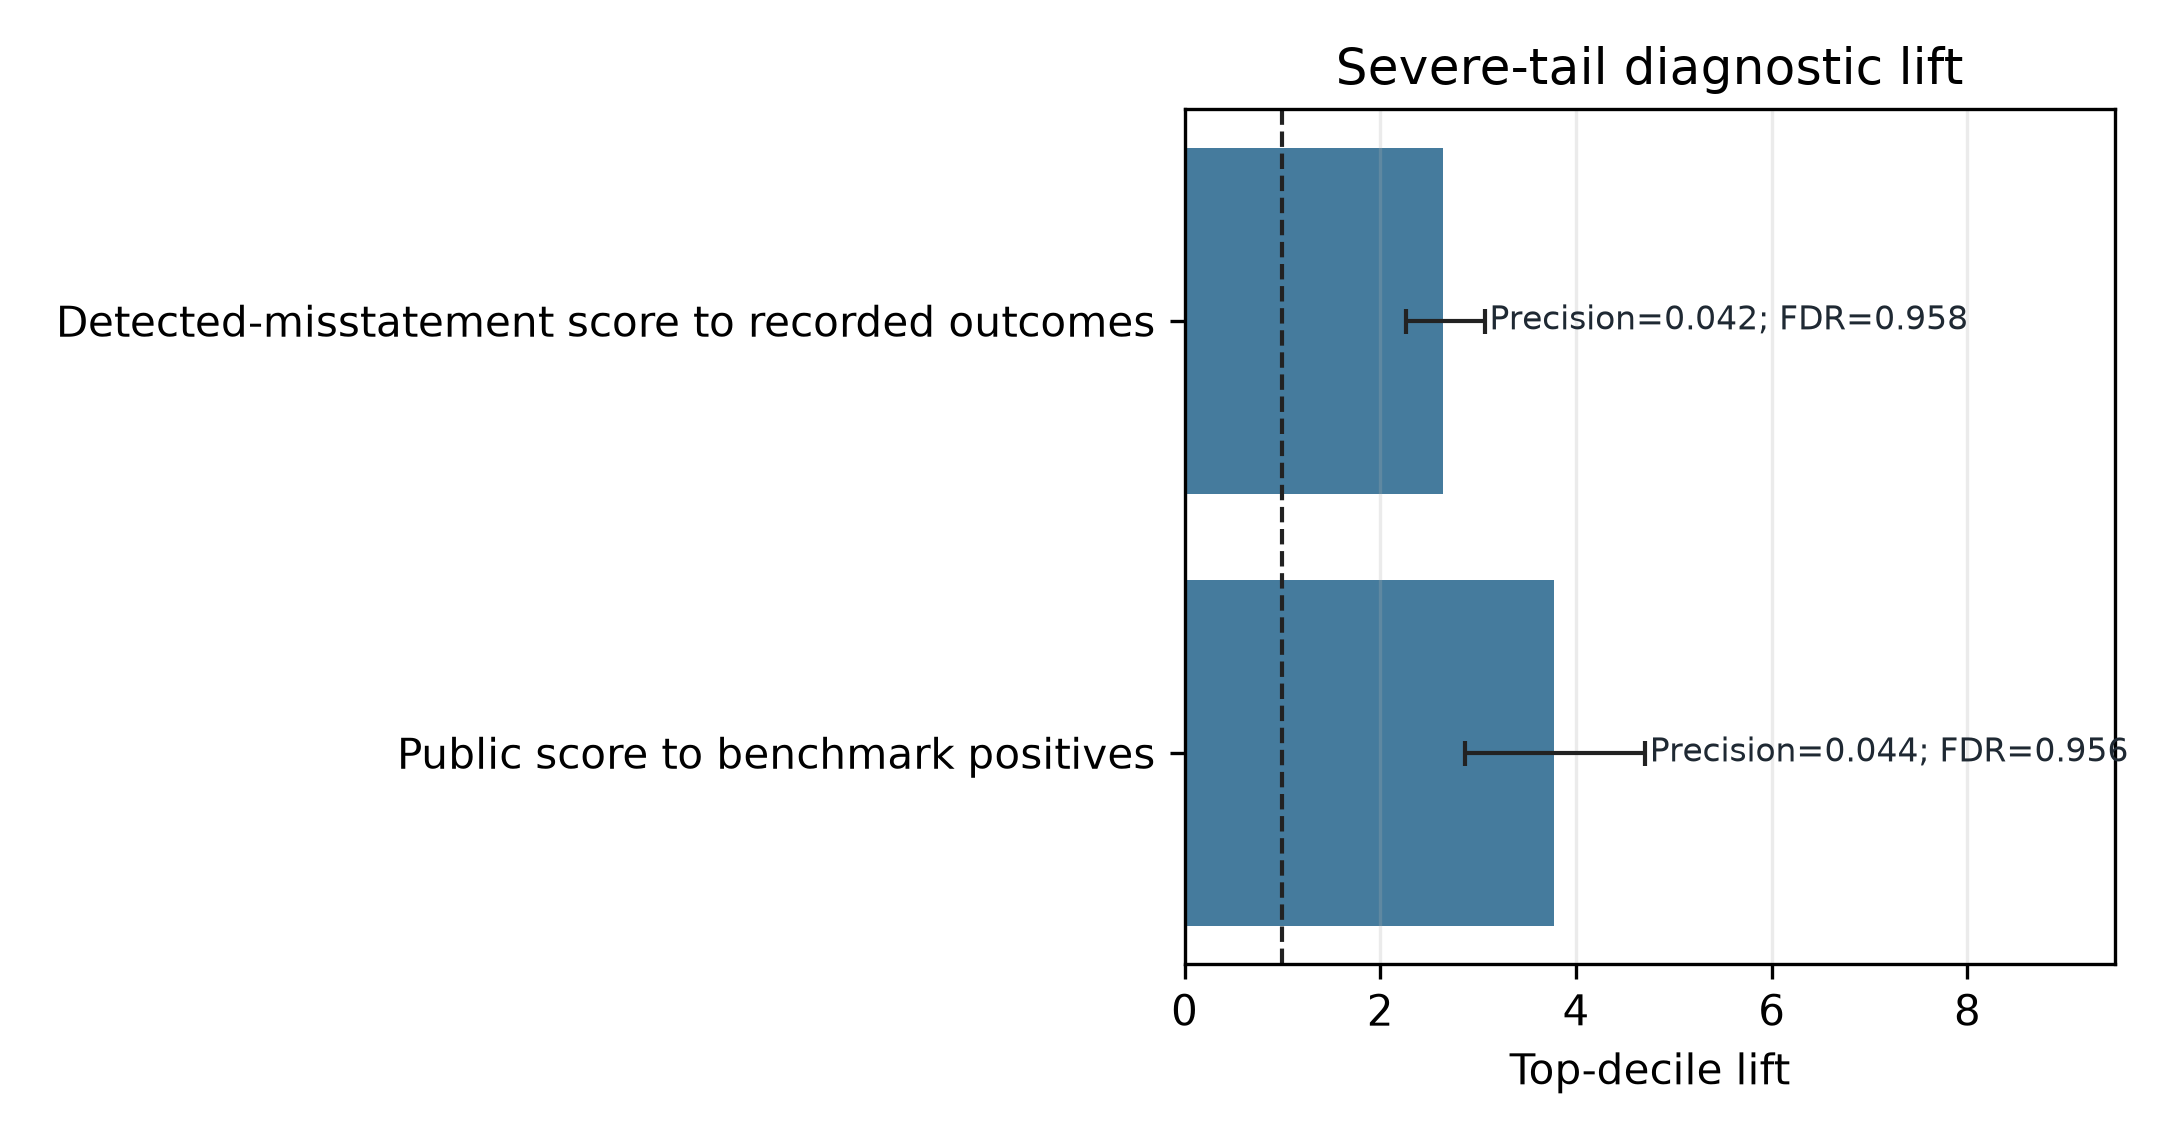
Figure note. Blue bars encode top-decile lift; capped black lines encode issuer-cluster percentile-bootstrap intervals; the dashed vertical line marks lift = 1; annotations report top-decile precision and FDR.
The declared primary ranking-alignment rows are severe-tail diagnostics. Lift above one shows enrichment, while low absolute precision and high FDR keep the interpretation bounded to construct overlap rather than event identification.
Exploratory maxima (post-hoc)
These exploratory, post-hoc maxima summarize the searched raw alignment grids. They disclose search-universe size and model-selection spread but never replace the generated Table 9 primary rows.
| Direction | Search-universe rows | Maximum-row keys | Maximum lift | Primary lift | max_minus_primary |
|---|---|---|---|---|---|
public_to_benchmark |
72 | {"bridge_tier": "high_confidence", "feature_set": "all", "label_mode": "benchmark_naive", "model_id": "public_cascade", "score_aggregation": "mean", "task": "8k_402", "train_window": "expanding"} |
3.7788 | 3.7788 | 0.0000 |
benchmark_to_public |
720 | {"bridge_tier": "high_confidence", "feature_set": "peer_compatible", "label_mode": "naive", "model_id": "bertomeu_style_xgb", "score_aggregation": "benchmark_score", "target_public_label": "label_8k_402_365", "train_window": "rolling_7y"} |
3.1360 | 2.6429 | 0.4931 |
The contingency matrix is the broader construct-validity evidence. Comment threads are broad submission-dated scrutiny outcomes, amendments show stronger correction/friction alignment, and Item 4.02 is a rare severe-tail state; the integrated claim rests on this typed pattern plus the bridge gate, not on Item 4.02 alone.
Aggregation Sensitivity
| Outcome label | Bridge tier | Aggregation rule | Rows | Pre-agg rate | Post-agg rate | Rate delta | Sensitive |
|---|---|---|---|---|---|---|---|
label_comment_thread_365 |
ambiguous |
label_max | 2,158 | 0.1896 | 0.3522 | 0.1626 | True |
label_comment_thread_365 |
high_confidence |
label_max | 44,183 | 0.3031 | 0.3031 | 0.0000 | False |
label_amendment_365 |
ambiguous |
label_max | 2,158 | 0.1152 | 0.2178 | 0.1026 | True |
label_amendment_365 |
high_confidence |
label_max | 44,183 | 0.2121 | 0.2121 | 0.0000 | False |
label_8k_402_365 |
ambiguous |
label_max | 2,158 | 0.0110 | 0.0218 | 0.0108 | True |
label_8k_402_365 |
high_confidence |
label_max | 44,183 | 0.0232 | 0.0232 | 0.0000 | False |
Benchmark-Positive Outcome Co-occurrence
| Pattern | Comment | Amendment | 8-K 4.02 | Benchmark positives | Share | Display count |
|---|---|---|---|---|---|---|
none |
0 | 0 | 0 | 513 | 0.3937 | 513 |
8k_402_365 |
0 | 0 | 1 | 41 | 0.0315 | 41 |
amendment_365 |
0 | 1 | 0 | 271 | 0.2080 | 271 |
amendment_365+8k_402_365 |
0 | 1 | 1 | 71 | 0.0545 | 71 |
comment_thread_365 |
1 | 0 | 0 | 178 | 0.1366 | 178 |
comment_thread_365+8k_402_365 |
1 | 0 | 1 | 39 | 0.0299 | 39 |
comment_thread_365+amendment_365 |
1 | 1 | 0 | 83 | 0.0637 | 83 |
comment_thread_365+amendment_365+8k_402_365 |
1 | 1 | 1 | 107 | 0.0821 | 107 |
Event-Time Concentration
| Relative year | Outcome label | Benchmark pos rows | Benchmark neg rows | Rate if benchmark pos | Rate if benchmark neg | Difference | Balanced window |
|---|---|---|---|---|---|---|---|
| -3 | label_comment_thread_365 |
610 | 20,518 | 0.1738 | 0.3014 | -0.1277 | True |
| -3 | label_amendment_365 |
610 | 20,518 | 0.2902 | 0.2028 | 0.0873 | True |
| -3 | label_8k_402_365 |
610 | 20,518 | 0.0213 | 0.0199 | 0.0014 | True |
| -2 | label_comment_thread_365 |
610 | 20,518 | 0.2066 | 0.3076 | -0.1010 | True |
| -2 | label_amendment_365 |
610 | 20,518 | 0.2984 | 0.1966 | 0.1018 | True |
| -2 | label_8k_402_365 |
610 | 20,518 | 0.0328 | 0.0213 | 0.0114 | True |
| -1 | label_comment_thread_365 |
610 | 20,518 | 0.2557 | 0.3066 | -0.0508 | True |
| -1 | label_amendment_365 |
610 | 20,518 | 0.3033 | 0.1859 | 0.1173 | True |
| -1 | label_8k_402_365 |
610 | 20,518 | 0.1049 | 0.0182 | 0.0867 | True |
| 0 | label_comment_thread_365 |
610 | 20,518 | 0.3344 | 0.3089 | 0.0256 | True |
| 0 | label_amendment_365 |
610 | 20,518 | 0.4082 | 0.1788 | 0.2294 | True |
| 0 | label_8k_402_365 |
610 | 20,518 | 0.2131 | 0.0166 | 0.1965 | True |
| 1 | label_comment_thread_365 |
610 | 20,518 | 0.3770 | 0.3064 | 0.0707 | True |
| 1 | label_amendment_365 |
610 | 20,518 | 0.3689 | 0.1701 | 0.1987 | True |
| 1 | label_8k_402_365 |
610 | 20,518 | 0.1934 | 0.0173 | 0.1761 | True |
| 2 | label_comment_thread_365 |
610 | 20,518 | 0.3902 | 0.3089 | 0.0813 | True |
| 2 | label_amendment_365 |
610 | 20,518 | 0.3098 | 0.1663 | 0.1435 | True |
| 2 | label_8k_402_365 |
610 | 20,518 | 0.1607 | 0.0180 | 0.1426 | True |
| 3 | label_comment_thread_365 |
610 | 20,518 | 0.3721 | 0.3038 | 0.0683 | True |
| 3 | label_amendment_365 |
610 | 20,518 | 0.2721 | 0.1801 | 0.0920 | True |
| 3 | label_8k_402_365 |
610 | 20,518 | 0.1164 | 0.0170 | 0.0994 | True |
Interpretation
Overlap results determine whether the benchmark and public cascade are related enough for an integrated construct argument. The evidence can support a related-but-non-identical interpretation only when bridge coverage, multiplicity, reciprocal alignment, and event-time concentration are all reported.
Discussion
The evidence supports a filing-origin measurement and ranking contribution, not a hidden-misconduct detector or calibrated deployment rule. The frozen public specification is interpreted against prevalence and calibration, while WRDS-validated overlap establishes related but non-identical constructs.
Answers to the research questions
- Outcome-model results support a prevalence-aware ranking claim for three review-and-correction outcomes, but calibration diagnostics keep the interpretation to ranking and prioritization.
- Recorded outcomes and detected-misstatement benchmark labels are related but non-identical constructs.
- Public-cascade scores can rank benchmark positives in the matched overlap; detected-misstatement scores can also rank severe correction outcomes.
- Selection-profile rows show that submission-dated correspondence partly reflects the scrutiny process, not a clean issuer-risk-only label.
wrds_validatedbridge evidence supports the integrated benchmark-to-public construct-overlap interpretation.
Comparison with prior literature
The detected-misstatement and outcome peer suites align model-family and metric language with prior accounting prediction work. They are transferred family diagnostics, not original-sample replications or same-estimand leaderboard comparisons.
Accounting and institutional interpretation
The outcomes record submission-dated correspondence, correction, and filing-friction states. The accounting contribution is therefore a filing-origin measurement and prioritization design, with machine learning serving as measurement infrastructure.
Selection and visibility
Correspondence and correction outcomes are partly selected by issuer visibility, filing history, source availability, and scrutiny. Selection-profile and opacity rows describe those boundaries without claiming a causal selection correction.
Prior-filing history means prior_filing_count, not PCAOB inspection. is_domestic_us_gaap_proxy means 10-K/10-K/A with no observed same-year FPI-form proxy and validates neither FPI status, domicile, nor US GAAP. PCAOB inspection archives are provenance inputs; inspection events are not joined to Gold, and there are no model-eligible inspection features.
Partner nonadministrative-amendment facts use the post-year-proxy uncensored public-model panel: 96734 rows evaluated, 96734 nonmissing, 0 nonzero, range [0, 0], is_constant_zero=true, and equality to Item 4.02 is false across 89181 rows.
Generalizability
Outcome-model findings generalize to the documented fiscal-year, filing-origin, and submission-date frame. Construct-overlap findings generalize only to the covered wrds_validated bridge sample.
Limitations and future work
- The evidence supports measurement and decision-useful ranking claims, not causal proof of hidden misconduct.
- Correspondence is submission-dated and disclosed later; it does not represent the complete SEC review universe.
- Negative Brier Skill Score or large ECE remains evidence against deployment-ready probability rules.
- External temporal validation and identified selection corrections remain future work rather than current findings.
Claim ledger
The controlled categories are reportable, supporting, diagnostic, and deferred; no headline is promoted from a raw maximum.
| Claim | Evidence | Category | Boundary |
|---|---|---|---|
| Filing-origin information ranks later submission-dated correspondence and public correction outcomes. | Generated Table 3, annual fold support, and Figure 1. | reportable |
Ranking evidence relative to prevalence, not calibrated deployment. |
| Feature and training-window patterns qualify the frozen public specification. | Generated Tables 4 and 14 plus Figure 2. | supporting |
Information-set evidence, not mechanism or XBRL dominance. |
| Recorded-outcome and detected-misstatement constructs are related but non-identical. | WRDS bridge coverage, generated Table 9, Figure 5, and contingency matrix. | supporting |
Conditional on bridge tier and covered sample. |
| Opacity/missingness has adjusted-association evidence for the recorded outcomes. | DML adjusted-association rows. | diagnostic |
Null or weak rows cannot support strategic-silence claims. |
| Exploratory maximum lifts describe the searched alignment grid. | Separately labeled post-hoc maximum table and search-universe counts. | diagnostic |
Never substitutes for the declared primary alignment rows. |
| The models identify hidden misconduct or causal regulatory effects. | No current artifact identifies either estimand. | deferred |
Requires a different design and evidence base. |
Reproducibility and Provenance
table_01_component_status
- Claim. All paper-facing study components are available for the current artifact-backed run.
- Evidence. Component statuses are read from the peer-enabled study manifest.
- Boundary. Component completion is a reproducibility status, not by itself a substantive empirical claim.
Table: Study component status for manuscript evidence
| Component | Status | Tier | Manuscript role |
|---|---|---|---|
| benchmark | complete | Detected-misstatement timing and model-family diagnostics | |
| public_cascade | complete | Filing-origin outcome-ranking evidence | |
| bridge_probe | crosswalk_available | CIK-GVKEY coverage and multiplicity checks | |
| peer_comparison | complete | Benchmark model-family transfer checks | |
| public_peer_comparison | complete | Review-and-correction model-family transfer checks | |
| construct_overlap | complete | wrds_validated | Bridge-gated related-construct evidence |
Run and package identity
| Field | Value |
|---|---|
| Artifact generation time | 2026-07-20T15:48:46+00:00 |
| Snapshot generation time | 2026-07-20T16:33:45+00:00 |
| Snapshot mode | full |
| Study commit | 08e5d255c657c16e658ee91b61096330f8fbe673 |
| Git dirty | True |
| Package schema | manuscript-package-v2 |
| Package study commit | 08e5d255c657c16e658ee91b61096330f8fbe673 |
| Package study-manifest hash | 5356cf9271c3e4c9cc78d9c05127c54cb3c8994a9c395c6f0ecbd1f46d3b98ff |
| Config hash | e4302457a2c7935e161339a0a353ca131332be7870f9e13e55b3dc8c90f12401 |
| Input hash | 4f9745e86820bd980c7fbbae9c060e29d18e3ea3c68880c1f06dc5d3b60cbdab |
| uv.lock hash | c9a3f55546c9ca7cbe812f0b2414c6eb97f749bd5dbd934099efc7275361e0f6 |
| Public-data as-of date | 2026-07-06 |
| Public-lake fresh build | True |
| Public-lake commit | de90b5fda2ed0b59bbda5a9b868c9d4b815f1b29 |
| Public-lake Git dirty | False |
| Public-lake config hash | a152148453ac37ae8eb44e577c817ffd587552cdafb24b2aa37b791cefe6e375 |
| Public-lake input hash | 98598df03c48b1f1f1a1fb44a2f880ee60d6446498aa1455f804ccc230b0bc42 |
| Public-lake uv.lock hash | c9a3f55546c9ca7cbe812f0b2414c6eb97f749bd5dbd934099efc7275361e0f6 |
| Form AP source kind | verified_zip_member |
| Form AP archive hash | 8358afa8393084673b80e1efc5535d21c389ec1ff7dbb500c75f681945322d12 |
| Form AP member | FirmFilings.csv |
| Form AP member hash | a05223c41169d4a2e80dd8e48e7367b6e0c55f2dafad3e987ec3cef4a34de5ee |
| WRDS source | 15 observed combinations across 4 WRDS source families in the current run; full values remain hash-bound in the study manifest |
| WRDS version | WRDS SEC Analytics Suite / CIK-GVKEY Link Table.csv |
| WRDS extraction time | 2026-07-13T08:19:42+00:00 |
| WRDS hash | b4881c8f1cc28aa4dbfdf5b8e4ca7971e0efc2c8ff918e99f2b18c587f1366d6 |
| Canonical status | NON-CANONICAL |
| Canonical predicate failures | dirty-state: study git_dirty is not false; identity: study and public-lake commits differ |
| Public-lake final-report schema | public-lake-final-report-v1 |
| Peer comparison mode | full |
| Bridge status | crosswalk_available |
| Construct-overlap validation tier | wrds_validated |
Source roles and hashes
Local input paths are omitted; stable roles, availability, and content hashes identify the evidence inputs.
| Source role | Available | SHA-256 |
|---|---|---|
| Detected-misstatement benchmark input | True |
468609b1879c6820618c01f051367eaea4094451087e9c51d3cd17b649bd05d2 |
| Public issuer dimension input | True |
103b4a95a443a1cec3ba2a371eb03c4ff1fd54fa9ecddc3e3412f7b6f596d695 |
| Public issuer-origin panel input | True |
51a1a713392e6f4f7ed8dafc06ae6b5860975753d1b36064157f6bbf0429a004 |
| Public-lake final report input | True |
acfd0f7b08b21e726038e03420c0490c65258a4b4629b5130022f510ad1ca27e |
| CIK-GVKEY bridge input | True |
b4881c8f1cc28aa4dbfdf5b8e4ca7971e0efc2c8ff918e99f2b18c587f1366d6 |
| Public-lake run metadata input | True |
7f945a95ae5c3f568ca6e8e612ca11b91872819f01848d043c3129d056978493 |
| Form AP source metadata input | True |
8c899fc2dc627ddbe6d4a507e840e3efdc7f74e3e6f885970a32b69aca6c28b6 |
Claim maturity
| Claim | Status |
|---|---|
| public_prediction | reportable |
| feature_and_window_sensitivity | supporting |
| construct_alignment | supporting |
| opacity_dml | diagnostic |